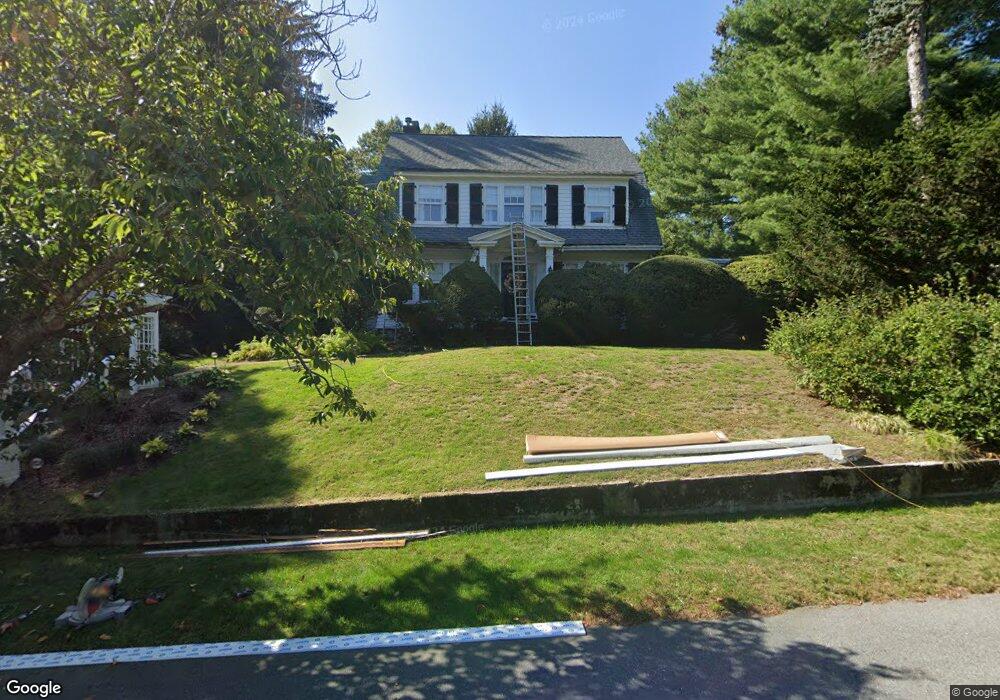
5 Mulherin Ln Wellesley Hills, MA 02481
Wellesley Hills NeighborhoodEstimated Value: $1,378,000 - $1,728,681
5
Beds
2
Baths
2,409
Sq Ft
$650/Sq Ft
Est. Value
About This Home
This home is located at 5 Mulherin Ln, Wellesley Hills, MA 02481 and is currently estimated at $1,564,920, approximately $649 per square foot. 5 Mulherin Ln is a home located in Norfolk County with nearby schools including Joseph E. Fiske Elementary School, Wellesley Middle School, and Wellesley Sr High School.
Ownership History
Date
Name
Owned For
Owner Type
Purchase Details
Closed on
May 6, 2008
Sold by
Moore Anna A
Bought by
Moore Mulherin Rt and Moore Anna A
Current Estimated Value
Purchase Details
Closed on
Nov 29, 1990
Sold by
Needham Coop Bank
Bought by
Moore Anna A
Home Financials for this Owner
Home Financials are based on the most recent Mortgage that was taken out on this home.
Original Mortgage
$155,000
Interest Rate
10.16%
Mortgage Type
Purchase Money Mortgage
Create a Home Valuation Report for This Property
The Home Valuation Report is an in-depth analysis detailing your home's value as well as a comparison with similar homes in the area
Home Values in the Area
Average Home Value in this Area
Purchase History
| Date | Buyer | Sale Price | Title Company |
|---|---|---|---|
| Moore Mulherin Rt | -- | -- | |
| Moore Anna A | $280,000 | -- |
Source: Public Records
Mortgage History
| Date | Status | Borrower | Loan Amount |
|---|---|---|---|
| Previous Owner | Moore Anna A | $155,000 |
Source: Public Records
Tax History Compared to Growth
Tax History
| Year | Tax Paid | Tax Assessment Tax Assessment Total Assessment is a certain percentage of the fair market value that is determined by local assessors to be the total taxable value of land and additions on the property. | Land | Improvement |
|---|---|---|---|---|
| 2025 | $16,325 | $1,588,000 | $1,381,000 | $207,000 |
| 2024 | $15,792 | $1,517,000 | $1,315,000 | $202,000 |
| 2023 | $16,030 | $1,400,000 | $1,230,000 | $170,000 |
| 2022 | $14,542 | $1,245,000 | $1,010,000 | $235,000 |
| 2021 | $14,629 | $1,245,000 | $1,010,000 | $235,000 |
| 2020 | $14,392 | $1,245,000 | $1,010,000 | $235,000 |
| 2019 | $13,872 | $1,199,000 | $964,000 | $235,000 |
| 2018 | $10,755 | $900,000 | $687,000 | $213,000 |
| 2017 | $10,623 | $901,000 | $688,000 | $213,000 |
| 2016 | $10,422 | $881,000 | $676,000 | $205,000 |
| 2015 | $9,664 | $836,000 | $640,000 | $196,000 |
Source: Public Records
Map
Nearby Homes