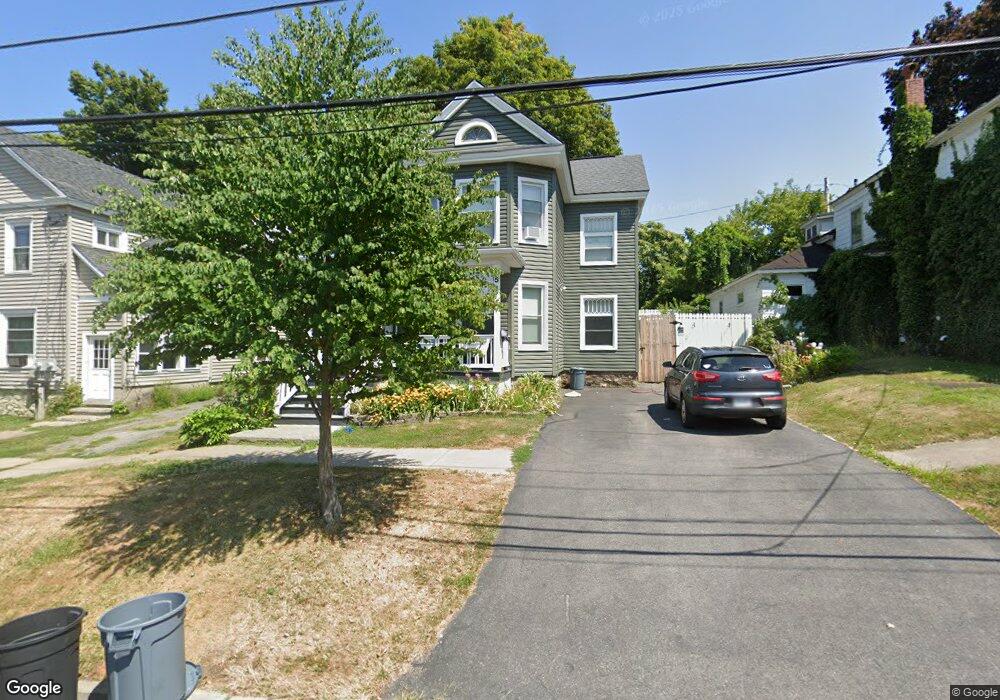
5 N 3rd St Fulton, NY 13069
Estimated Value: $150,000 - $172,000
4
Beds
2
Baths
2,232
Sq Ft
$72/Sq Ft
Est. Value
About This Home
This home is located at 5 N 3rd St, Fulton, NY 13069 and is currently estimated at $159,822, approximately $71 per square foot. 5 N 3rd St is a home located in Oswego County with nearby schools including G Ray Bodley High School.
Ownership History
Date
Name
Owned For
Owner Type
Purchase Details
Closed on
Jun 5, 2007
Sold by
Hsbc Bank Usa Na
Bought by
Halstead John M and Halstead Penny I
Current Estimated Value
Home Financials for this Owner
Home Financials are based on the most recent Mortgage that was taken out on this home.
Original Mortgage
$56,000
Interest Rate
6.54%
Mortgage Type
Purchase Money Mortgage
Purchase Details
Closed on
Apr 21, 2005
Sold by
Montgomery George H and Montgomery Julie A
Bought by
Piddock Rebecca
Home Financials for this Owner
Home Financials are based on the most recent Mortgage that was taken out on this home.
Original Mortgage
$68,000
Interest Rate
6.01%
Mortgage Type
Fannie Mae Freddie Mac
Purchase Details
Closed on
Mar 30, 1994
Create a Home Valuation Report for This Property
The Home Valuation Report is an in-depth analysis detailing your home's value as well as a comparison with similar homes in the area
Home Values in the Area
Average Home Value in this Area
Purchase History
| Date | Buyer | Sale Price | Title Company |
|---|---|---|---|
| Halstead John M | $56,000 | None Available | |
| Piddock Rebecca | $85,000 | None Available | |
| -- | -- | -- |
Source: Public Records
Mortgage History
| Date | Status | Borrower | Loan Amount |
|---|---|---|---|
| Previous Owner | Halstead John M | $56,000 | |
| Previous Owner | Piddock Rebecca | $68,000 |
Source: Public Records
Tax History Compared to Growth
Tax History
| Year | Tax Paid | Tax Assessment Tax Assessment Total Assessment is a certain percentage of the fair market value that is determined by local assessors to be the total taxable value of land and additions on the property. | Land | Improvement |
|---|---|---|---|---|
| 2024 | $5,723 | $113,700 | $2,900 | $110,800 |
| 2023 | $5,527 | $113,700 | $2,900 | $110,800 |
| 2022 | $4,387 | $113,700 | $2,900 | $110,800 |
| 2021 | $3,610 | $60,000 | $8,100 | $51,900 |
| 2020 | $2,760 | $60,000 | $8,100 | $51,900 |
| 2019 | $2,699 | $60,000 | $8,100 | $51,900 |
| 2018 | $2,699 | $60,000 | $8,100 | $51,900 |
| 2017 | $2,687 | $60,000 | $8,100 | $51,900 |
| 2016 | $2,713 | $60,000 | $8,100 | $51,900 |
| 2015 | -- | $60,000 | $8,100 | $51,900 |
| 2014 | -- | $60,000 | $8,100 | $51,900 |
Source: Public Records
Map
Nearby Homes
- 0 County Route 4 Unit S1652795
- 524 Rochester St
- 171 N 5th St
- 614 Utica St
- 00 Seventh Ave
- 514 Academy St
- 308 Academy St
- 707 Emery St
- 57 W 1st St S
- 0 New York 48
- 822 Oneida St
- 719 Seward St
- 115 Phillips St
- 407 State St
- 890 Cayuga St
- 210 Walradt St
- 1633 State Route 48
- 1021 Cayuga St
- 871 Oneida St
- 211 Pratt St