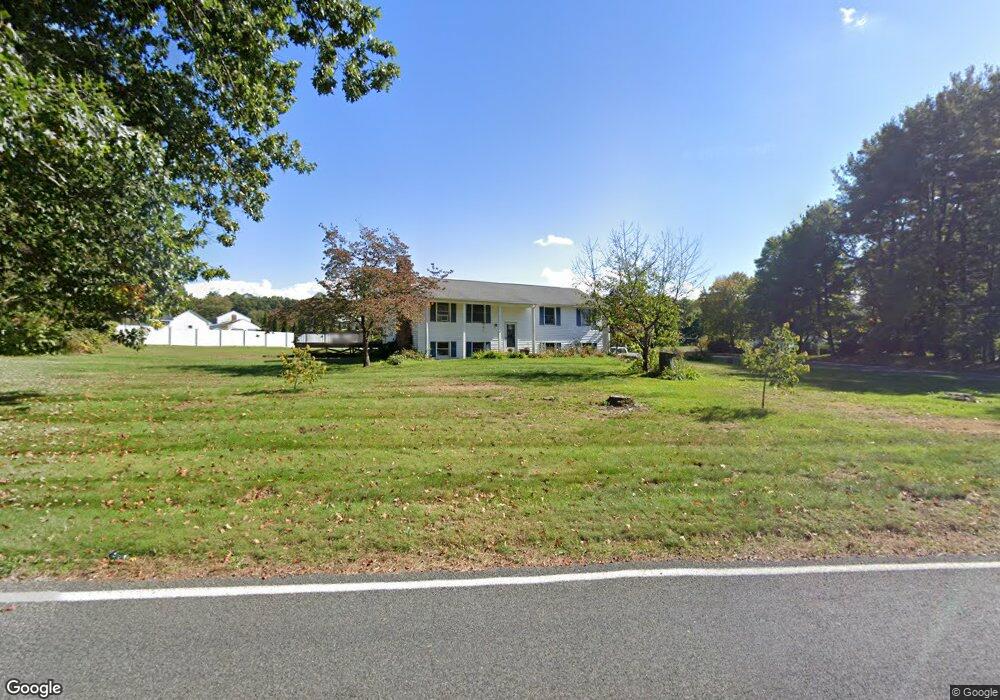
5 Noah Chapin Dr Somers, CT 06071
Estimated Value: $385,000 - $461,000
4
Beds
3
Baths
1,350
Sq Ft
$303/Sq Ft
Est. Value
About This Home
This home is located at 5 Noah Chapin Dr, Somers, CT 06071 and is currently estimated at $408,921, approximately $302 per square foot. 5 Noah Chapin Dr is a home located in Tolland County with nearby schools including Somers Elementary School, Mabelle B. Avery Middle School, and Somers High School.
Ownership History
Date
Name
Owned For
Owner Type
Purchase Details
Closed on
Sep 9, 2025
Sold by
Vecchiarelli Timothy J
Bought by
Vecchiarelli Timothy J and Vecchiarelli Nicholas S
Current Estimated Value
Purchase Details
Closed on
Apr 2, 1985
Bought by
Vecchiarelli Timothy
Create a Home Valuation Report for This Property
The Home Valuation Report is an in-depth analysis detailing your home's value as well as a comparison with similar homes in the area
Home Values in the Area
Average Home Value in this Area
Purchase History
| Date | Buyer | Sale Price | Title Company |
|---|---|---|---|
| Vecchiarelli Timothy J | -- | -- | |
| Vecchiarelli Timothy | -- | -- |
Source: Public Records
Mortgage History
| Date | Status | Borrower | Loan Amount |
|---|---|---|---|
| Previous Owner | Vecchiarelli Timothy | $75,000 | |
| Previous Owner | Vecchiarelli Timothy | $51,450 |
Source: Public Records
Tax History
| Year | Tax Paid | Tax Assessment Tax Assessment Total Assessment is a certain percentage of the fair market value that is determined by local assessors to be the total taxable value of land and additions on the property. | Land | Improvement |
|---|---|---|---|---|
| 2025 | $4,918 | $162,800 | $67,400 | $95,400 |
| 2024 | $4,715 | $162,800 | $67,400 | $95,400 |
| 2023 | $4,609 | $162,800 | $67,400 | $95,400 |
| 2022 | $4,487 | $162,800 | $67,400 | $95,400 |
| 2021 | $4,340 | $162,800 | $67,400 | $95,400 |
| 2020 | $4,678 | $170,900 | $67,400 | $103,500 |
| 2019 | $4,396 | $160,600 | $72,700 | $87,900 |
| 2018 | $4,396 | $160,600 | $72,700 | $87,900 |
| 2017 | $4,090 | $160,600 | $72,700 | $87,900 |
| 2016 | $3,890 | $160,600 | $72,700 | $87,900 |
| 2015 | $4,073 | $174,300 | $79,700 | $94,600 |
| 2014 | $4,073 | $174,300 | $79,700 | $94,600 |
Source: Public Records
Map
Nearby Homes
- 63 Maple Ridge Dr
- 969 Main St
- 64 Bradfield Dr
- 369 Turnpike Rd
- 142 Turnpike Rd
- 139 Hall Hill Rd
- 138 Main St
- 11 King Rd
- 64 Somerset Ln
- 5 Cantlewood Dr
- 190 Root Rd
- 18 Hillcrest Dr
- 283 Mountain View Rd
- 557 Hall Hill Rd
- 12 & 16 Haas Rd
- 80 Brewster Rd
- 1040 Main St
- 994 Main St
- 42 Schneider Rd
- 193 Webster Rd