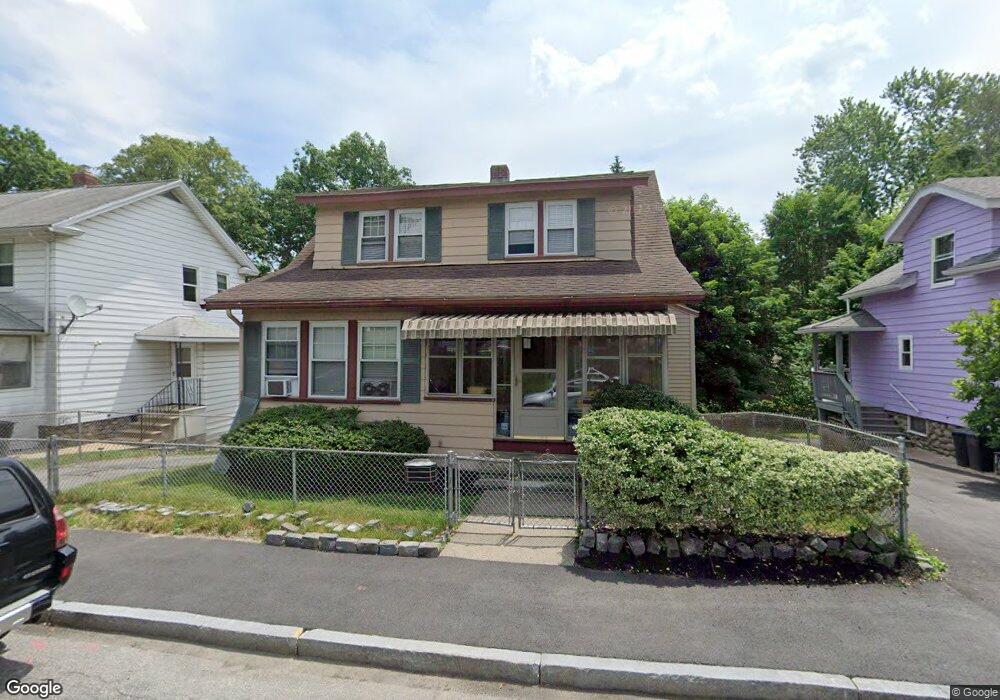
5 Norcross St Worcester, MA 01602
Columbus Park NeighborhoodEstimated Value: $366,000 - $433,000
3
Beds
2
Baths
1,396
Sq Ft
$286/Sq Ft
Est. Value
About This Home
This home is located at 5 Norcross St, Worcester, MA 01602 and is currently estimated at $399,589, approximately $286 per square foot. 5 Norcross St is a home located in Worcester County with nearby schools including Chandler Magnet, Jacob Hiatt Magnet School, and May Street Elementary School.
Ownership History
Date
Name
Owned For
Owner Type
Purchase Details
Closed on
Jul 17, 2000
Sold by
Department Of Housing & Urban Dev
Bought by
Miglionico Thomas A and Miglionico Myra
Current Estimated Value
Purchase Details
Closed on
Oct 27, 1999
Sold by
Hsbc Bank
Bought by
Usa Sec Housing & Dev
Purchase Details
Closed on
Sep 17, 1999
Sold by
Tobojka Slawomir
Bought by
Hsbc Bank
Purchase Details
Closed on
May 1, 1992
Sold by
Lahey Michael E and Lahey Patricia
Bought by
Tobojka Slawomir and Tobojka Kimberly
Create a Home Valuation Report for This Property
The Home Valuation Report is an in-depth analysis detailing your home's value as well as a comparison with similar homes in the area
Home Values in the Area
Average Home Value in this Area
Purchase History
| Date | Buyer | Sale Price | Title Company |
|---|---|---|---|
| Miglionico Thomas A | $108,500 | -- | |
| Usa Sec Housing & Dev | $112,535 | -- | |
| Hsbc Bank | $112,535 | -- | |
| Tobojka Slawomir | $105,000 | -- |
Source: Public Records
Mortgage History
| Date | Status | Borrower | Loan Amount |
|---|---|---|---|
| Open | Tobojka Slawomir | $155,000 | |
| Closed | Tobojka Slawomir | $27,870 | |
| Closed | Tobojka Slawomir | $20,000 |
Source: Public Records
Tax History
| Year | Tax Paid | Tax Assessment Tax Assessment Total Assessment is a certain percentage of the fair market value that is determined by local assessors to be the total taxable value of land and additions on the property. | Land | Improvement |
|---|---|---|---|---|
| 2025 | $4,342 | $329,200 | $105,900 | $223,300 |
| 2024 | $4,249 | $309,000 | $105,900 | $203,100 |
| 2023 | $4,080 | $284,500 | $92,000 | $192,500 |
| 2022 | $3,722 | $244,700 | $73,600 | $171,100 |
| 2021 | $3,596 | $220,900 | $58,900 | $162,000 |
| 2020 | $3,519 | $207,000 | $58,900 | $148,100 |
| 2019 | $3,321 | $184,500 | $53,000 | $131,500 |
| 2018 | $3,304 | $174,700 | $53,000 | $121,700 |
| 2017 | $3,192 | $166,100 | $53,000 | $113,100 |
| 2016 | $3,188 | $154,700 | $40,000 | $114,700 |
| 2015 | $3,105 | $154,700 | $40,000 | $114,700 |
| 2014 | $3,023 | $154,700 | $40,000 | $114,700 |
Source: Public Records
Map
Nearby Homes
- 24 Geneva St
- 28 Walworth St
- 33 Carlisle St
- 9 Fiske St Unit A
- 24 Hadwen Rd
- 15 Longfellow Rd
- 211 June St Unit B
- 10 Minthorne St
- 60 June St
- 108 Longfellow Rd
- 34 Rosslare Dr Unit 108
- 16 Sherwood Rd
- 12 Westfield St
- 114 Lovell St
- 32 Zenith Dr
- 18 Hadwen Ln
- 6 Ludington Rd
- 345 Park Ave
- 212 Dewey St
- 6 Newton Ave
Your Personal Tour Guide
Ask me questions while you tour the home.