5 Nottingham Rd Canterbury, NH 03224
Estimated Value: $335,000 - $377,000
2
Beds
1
Bath
1,476
Sq Ft
$242/Sq Ft
Est. Value
About This Home
This home is located at 5 Nottingham Rd, Canterbury, NH 03224 and is currently estimated at $356,554, approximately $241 per square foot. 5 Nottingham Rd is a home located in Merrimack County with nearby schools including Canterbury Elementary School, Belmont Middle School, and Belmont High School.
Ownership History
Date
Name
Owned For
Owner Type
Purchase Details
Closed on
Jul 22, 2021
Sold by
Sanborn Jonas
Bought by
Sanborn Heidi and Sanborn Jonas D
Current Estimated Value
Home Financials for this Owner
Home Financials are based on the most recent Mortgage that was taken out on this home.
Original Mortgage
$173,600
Interest Rate
3%
Mortgage Type
Stand Alone Refi Refinance Of Original Loan
Purchase Details
Closed on
Nov 22, 2002
Sold by
Laventure Irene
Bought by
Sanborn David W and Sanborn Jenny M
Home Financials for this Owner
Home Financials are based on the most recent Mortgage that was taken out on this home.
Original Mortgage
$67,500
Interest Rate
6.07%
Mortgage Type
Purchase Money Mortgage
Create a Home Valuation Report for This Property
The Home Valuation Report is an in-depth analysis detailing your home's value as well as a comparison with similar homes in the area
Home Values in the Area
Average Home Value in this Area
Purchase History
| Date | Buyer | Sale Price | Title Company |
|---|---|---|---|
| Sanborn Heidi | -- | None Available | |
| Sanborn Heidi | -- | None Available | |
| Sanborn David W | $75,000 | -- | |
| Sanborn David W | $75,000 | -- |
Source: Public Records
Mortgage History
| Date | Status | Borrower | Loan Amount |
|---|---|---|---|
| Previous Owner | Sanborn Heidi | $173,600 | |
| Previous Owner | Sanborn David W | $67,500 |
Source: Public Records
Tax History Compared to Growth
Tax History
| Year | Tax Paid | Tax Assessment Tax Assessment Total Assessment is a certain percentage of the fair market value that is determined by local assessors to be the total taxable value of land and additions on the property. | Land | Improvement |
|---|---|---|---|---|
| 2024 | $4,497 | $198,300 | $73,600 | $124,700 |
| 2023 | $4,143 | $197,300 | $73,600 | $123,700 |
| 2022 | $3,698 | $177,800 | $73,600 | $104,200 |
| 2021 | $3,647 | $177,800 | $73,600 | $104,200 |
| 2020 | $3,289 | $119,200 | $45,100 | $74,100 |
| 2019 | $3,322 | $119,200 | $45,100 | $74,100 |
| 2018 | $3,167 | $119,200 | $45,100 | $74,100 |
| 2017 | $3,097 | $119,200 | $45,100 | $74,100 |
| 2016 | $2,974 | $119,200 | $45,100 | $74,100 |
| 2015 | $2,911 | $109,600 | $40,200 | $69,400 |
| 2014 | $2,965 | $109,600 | $40,200 | $69,400 |
| 2013 | $2,865 | $109,600 | $40,200 | $69,400 |
Source: Public Records
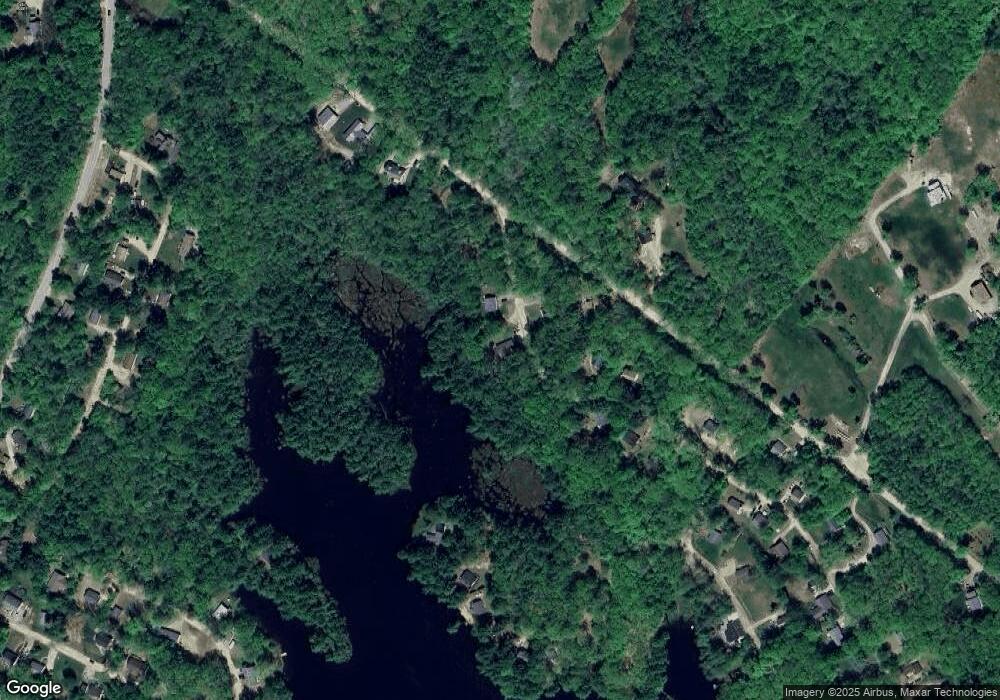
Map
Nearby Homes
- 16 Sherwood Forest Dr
- 19 Sherwood Forest Dr
- 23 Canterbury Crossing
- 18 Shady Ln
- 0 Polly Ham Rd
- 445 Shaker Rd
- 162 Main St
- 46 Depot St
- 50 Depot St
- 28 Great Brook Dr
- 17 Lilac Ln
- 22 Great Brook Dr
- 8 Lilac Ln
- 34 Circle Dr
- 36 Dearborn St
- Map 132 Lot 115 Arrowhead Ln
- 22 Saint Joseph Dr
- 9 Warbonnet Ln
- 306 Baptist Hill Rd
- 153 Lakeshore Dr
- 3 Nottingham Rd
- 4 Nottingham Rd
- 0 Nottingham Rd
- 6 Nottingham Rd
- 8 Nottingham Rd
- 29 Old Gilmanton Rd
- 29 Old Gilmanton Rd Unit 276
- 33 Old Gilmanton Rd
- 27 Old Gilmanton Rd
- 9 Nottingham Rd
- 10 Nottingham Rd
- 36 Old Gilmanton Rd
- 15 Nottingham Rd
- 120 Canterbury Shore Dr
- 21 Old Gilmanton Rd
- 116 Canterbury Shore Dr
- 101 Canterbury Shore Dr
- 114 Canterbury Shore Dr
- 19 Old Gilmanton Rd
- 19 Nottingham Rd