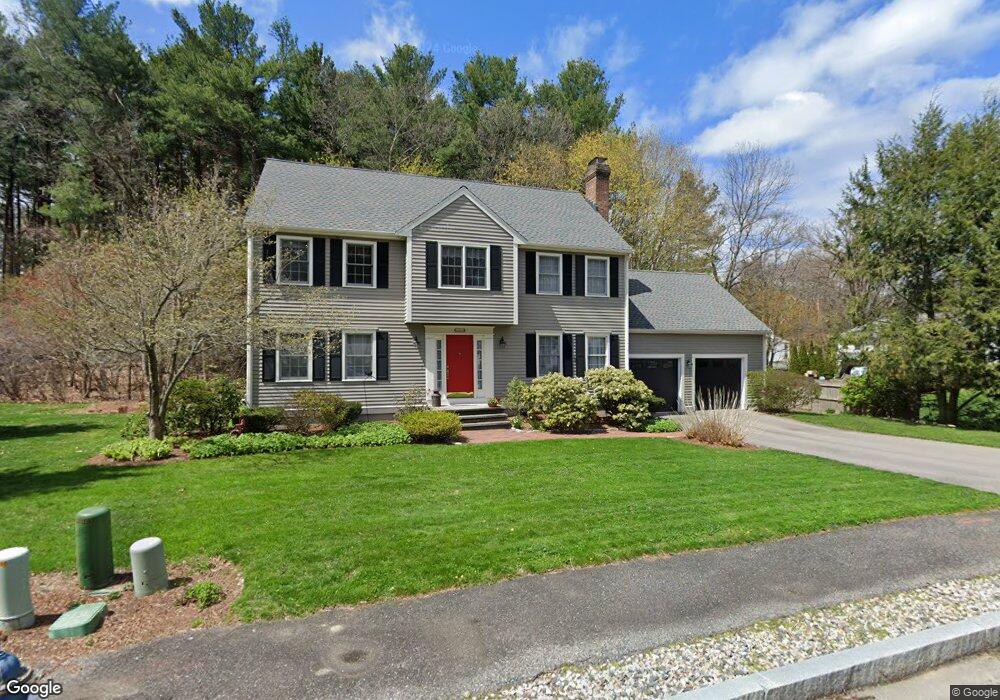
5 Oakwood Ct Framingham, MA 01701
Saxonville NeighborhoodEstimated Value: $799,000 - $937,000
4
Beds
3
Baths
2,289
Sq Ft
$386/Sq Ft
Est. Value
About This Home
This home is located at 5 Oakwood Ct, Framingham, MA 01701 and is currently estimated at $882,762, approximately $385 per square foot. 5 Oakwood Ct is a home located in Middlesex County with nearby schools including Framingham High School and MetroWest Jewish Day School.
Ownership History
Date
Name
Owned For
Owner Type
Purchase Details
Closed on
Jul 15, 2019
Sold by
Golder Sheldon P and Golder Jane G
Bought by
Jash Golder Ft and Golder
Current Estimated Value
Purchase Details
Closed on
Jul 23, 1999
Sold by
Connoy Rebecca L
Bought by
Golder Sheldon P and Golder Jane G
Home Financials for this Owner
Home Financials are based on the most recent Mortgage that was taken out on this home.
Original Mortgage
$135,000
Interest Rate
7.49%
Mortgage Type
Purchase Money Mortgage
Purchase Details
Closed on
May 23, 1995
Sold by
Triton Constr Corp
Bought by
Connoy Rebecca L and Connoy Patrick J
Home Financials for this Owner
Home Financials are based on the most recent Mortgage that was taken out on this home.
Original Mortgage
$160,000
Interest Rate
8.34%
Mortgage Type
Purchase Money Mortgage
Create a Home Valuation Report for This Property
The Home Valuation Report is an in-depth analysis detailing your home's value as well as a comparison with similar homes in the area
Home Values in the Area
Average Home Value in this Area
Purchase History
| Date | Buyer | Sale Price | Title Company |
|---|---|---|---|
| Jash Golder Ft | -- | -- | |
| Jash Golder Ft | -- | -- | |
| Golder Sheldon P | $378,000 | -- | |
| Connoy Rebecca L | $281,500 | -- | |
| Connoy Rebecca L | $281,500 | -- |
Source: Public Records
Mortgage History
| Date | Status | Borrower | Loan Amount |
|---|---|---|---|
| Previous Owner | Connoy Rebecca L | $135,000 | |
| Previous Owner | Connoy Rebecca L | $160,000 | |
| Closed | Connoy Rebecca L | $90,000 |
Source: Public Records
Tax History Compared to Growth
Tax History
| Year | Tax Paid | Tax Assessment Tax Assessment Total Assessment is a certain percentage of the fair market value that is determined by local assessors to be the total taxable value of land and additions on the property. | Land | Improvement |
|---|---|---|---|---|
| 2025 | $10,222 | $856,100 | $271,100 | $585,000 |
| 2024 | $10,034 | $805,300 | $242,200 | $563,100 |
| 2023 | $9,685 | $739,900 | $216,100 | $523,800 |
| 2022 | $9,261 | $674,000 | $196,100 | $477,900 |
| 2021 | $8,998 | $640,400 | $188,500 | $451,900 |
| 2020 | $9,172 | $612,300 | $171,300 | $441,000 |
| 2019 | $9,126 | $593,400 | $171,300 | $422,100 |
| 2018 | $9,234 | $565,800 | $164,900 | $400,900 |
| 2017 | $9,077 | $543,200 | $160,100 | $383,100 |
| 2016 | $8,973 | $516,300 | $160,100 | $356,200 |
| 2015 | $8,557 | $480,200 | $160,700 | $319,500 |
Source: Public Records
Map
Nearby Homes
- 84 Hopestill Brown Rd
- 0 Wagonwheel Rd
- 8 Clara Rd
- 63 Landham Rd
- 14 Francine Rd
- 24 Pinewood Dr
- 14 Eisenhower Rd
- 81 Nicholas Rd Unit B
- 19 Park Ave
- 71 Nicholas Rd Unit H
- 163 Water St
- 82 Joseph Rd
- 53 Davidson Rd
- 40 Gregory Rd
- 8 Elm St Unit 8A
- 91 Eaton Rd W
- 19 Nob Hill Dr
- 29 Derby St
- 41 James St
- 32 Eaton Rd W