
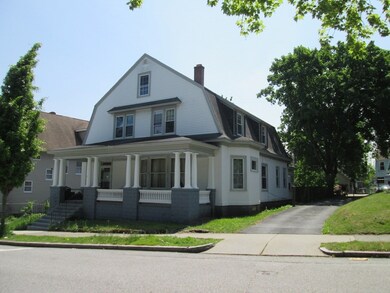


5 Oberlin St Unit 2 Worcester, MA 01610
University Park NeighborhoodHighlights
- Property is near public transit
- No HOA
- Park
- Wood Flooring
- Porch
- Baseboard Heating
About This Home
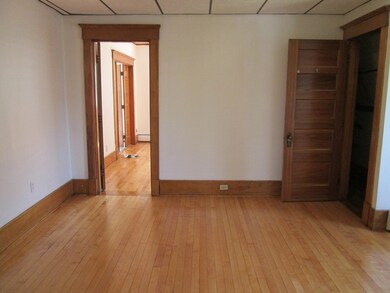
Opportunity knocks....new rental price! This Grand home built in 1920 is a single family home that was modified to apartments. This unit is the second floor with gleaming hardwood floors...large rooms and big windows. Kitchen ready for breakfast/dining area...Appliances include range, refrigerator and microwave. ....Three bedrooms .....and a spacious bathroom. The area is near Clark University and Claremont Academy. Easy access for busline, shopping...parks. Laundry in basement. Off street parking with shared tenants. Ready to move in!
Property Details
Home Type
- Multi-Family
Year Built
- Built in 1920
Parking
- 1 Car Parking Space
Home Design
- Apartment
- Entry on the 2nd floor
Interior Spaces
- 1,200 Sq Ft Home
- Laundry in Basement
Kitchen
- Range
- Microwave
Flooring
- Wood
- Vinyl
Bedrooms and Bathrooms
- 2 Bedrooms
- Primary bedroom located on second floor
- 1 Full Bathroom
Location
- Property is near public transit
- Property is near schools
Schools
- Claremont Academy Elementary School
- South High School
Utilities
- No Cooling
- Heating System Uses Natural Gas
- Baseboard Heating
Additional Features
- Porch
- 8,350 Sq Ft Lot
Listing and Financial Details
- Security Deposit $1,950
- Rent includes water, sewer, laundry facilities
- Assessor Parcel Number 1768068
Community Details
Recreation
- Park
Pet Policy
- Call for details about the types of pets allowed
Additional Features
- No Home Owners Association
- Laundry Facilities
Map
Property History
| Date | Event | Price | List to Sale | Price per Sq Ft |
|---|---|---|---|---|
| 12/07/2025 12/07/25 | For Rent | $1,950 | 0.0% | -- |
| 11/16/2025 11/16/25 | Off Market | $1,950 | -- | -- |
| 10/09/2025 10/09/25 | For Rent | $1,950 | 0.0% | -- |
| 10/01/2025 10/01/25 | Off Market | $1,950 | -- | -- |
| 08/27/2025 08/27/25 | Price Changed | $1,950 | -11.4% | $2 / Sq Ft |
| 08/17/2025 08/17/25 | For Rent | $2,200 | -- | -- |
Source: MLS Property Information Network (MLS PIN)
MLS Number: 73418960
APN: WORC-000006-000037-000040
Disclaimer: Certain information contained herein is derived from information provided by parties other than Homes.com. All information provided is deemed reliable, but is not guaranteed to be accurate and should be independently verified.
![]() The property listing data and information, or the Images, set forth herein were provided to MLS Property Information Network, Inc. from third party sources, including sellers, lessors and public records, and were compiled by MLS Property Information Network, Inc. The property listing data and information, and the Images, are for the personal, non-commercial use of consumers having a good faith interest in purchasing or leasing listed properties of the type displayed to them and may not be used for any purpose other than to identify prospective properties which such consumers may have a good faith interest in purchasing or leasing. MLS Property Information Network, Inc. and its subscribers disclaim any and all representations and warranties as to the accuracy of the property listing data and information, or as to the accuracy of any of the Images, set forth herein.
The property listing data and information, or the Images, set forth herein were provided to MLS Property Information Network, Inc. from third party sources, including sellers, lessors and public records, and were compiled by MLS Property Information Network, Inc. The property listing data and information, and the Images, are for the personal, non-commercial use of consumers having a good faith interest in purchasing or leasing listed properties of the type displayed to them and may not be used for any purpose other than to identify prospective properties which such consumers may have a good faith interest in purchasing or leasing. MLS Property Information Network, Inc. and its subscribers disclaim any and all representations and warranties as to the accuracy of the property listing data and information, or as to the accuracy of any of the Images, set forth herein.
- 31 Oberlin St Unit 3
- 41 Hollywood St Unit . 1
- 41 Hollywood St Unit 2
- 41 Hollywood St Unit 3
- 2 Grout Ct
- 32 Clifton St Unit 2
- 6 Hammond St Unit 3
- 31 Ripley St Unit 3
- 39 Florence St Unit 2
- 25 Wyman St
- 25 Wyman St
- 20 Florence St Unit 2
- 3 Allen St Unit 6
- 45 Grand St
- 40 Grand St Unit 2
- 7 Cristy St Unit Cristy 1st FL
- 69 Hollis St Unit 1-3
- 63 Gates St Unit 3
- 78 Hollis St Unit 3
- 43 Oread St Unit 2
