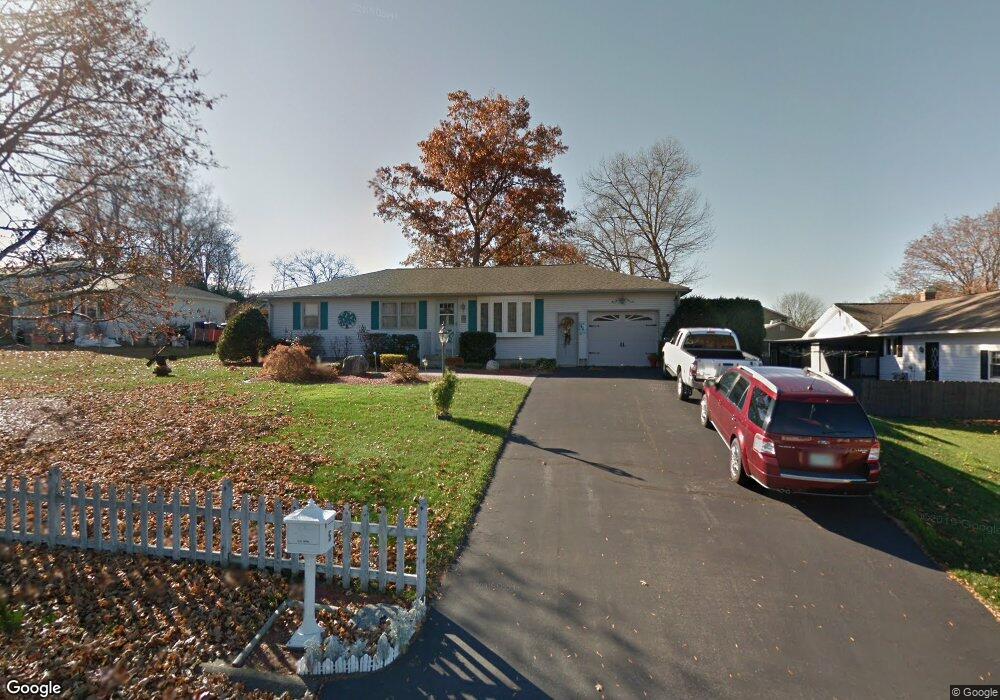
5 Overlook Dr Easthampton, MA 01027
Estimated Value: $442,000 - $538,000
2
Beds
3
Baths
1,680
Sq Ft
$283/Sq Ft
Est. Value
About This Home
This home is located at 5 Overlook Dr, Easthampton, MA 01027 and is currently estimated at $475,068, approximately $282 per square foot. 5 Overlook Dr is a home located in Hampshire County with nearby schools including Easthampton High School, Tri-County Schools, and New England Adolescent Research Institute.
Ownership History
Date
Name
Owned For
Owner Type
Purchase Details
Closed on
Jun 14, 1990
Sold by
Boyle Thomas J
Bought by
Oconnell Barry T
Current Estimated Value
Home Financials for this Owner
Home Financials are based on the most recent Mortgage that was taken out on this home.
Original Mortgage
$97,600
Interest Rate
10.54%
Mortgage Type
Purchase Money Mortgage
Create a Home Valuation Report for This Property
The Home Valuation Report is an in-depth analysis detailing your home's value as well as a comparison with similar homes in the area
Home Values in the Area
Average Home Value in this Area
Purchase History
| Date | Buyer | Sale Price | Title Company |
|---|---|---|---|
| Oconnell Barry T | $122,000 | -- |
Source: Public Records
Mortgage History
| Date | Status | Borrower | Loan Amount |
|---|---|---|---|
| Open | Oconnell Barry T | $125,000 | |
| Closed | Oconnell Barry T | $25,000 | |
| Closed | Oconnell Barry T | $58,000 | |
| Closed | Oconnell Barry T | $97,600 |
Source: Public Records
Tax History
| Year | Tax Paid | Tax Assessment Tax Assessment Total Assessment is a certain percentage of the fair market value that is determined by local assessors to be the total taxable value of land and additions on the property. | Land | Improvement |
|---|---|---|---|---|
| 2025 | $5,687 | $416,000 | $118,600 | $297,400 |
| 2024 | $5,490 | $404,900 | $115,200 | $289,700 |
| 2023 | $4,112 | $280,700 | $90,700 | $190,000 |
| 2022 | $4,640 | $280,700 | $90,700 | $190,000 |
| 2021 | $5,092 | $290,300 | $90,700 | $199,600 |
| 2020 | $4,985 | $280,700 | $90,700 | $190,000 |
| 2019 | $4,162 | $269,200 | $90,700 | $178,500 |
| 2018 | $3,981 | $248,800 | $85,600 | $163,200 |
| 2017 | $3,884 | $239,600 | $82,200 | $157,400 |
| 2016 | $3,879 | $248,800 | $82,200 | $166,600 |
| 2015 | $3,769 | $248,800 | $82,200 | $166,600 |
Source: Public Records
Map
Nearby Homes
Your Personal Tour Guide
Ask me questions while you tour the home.