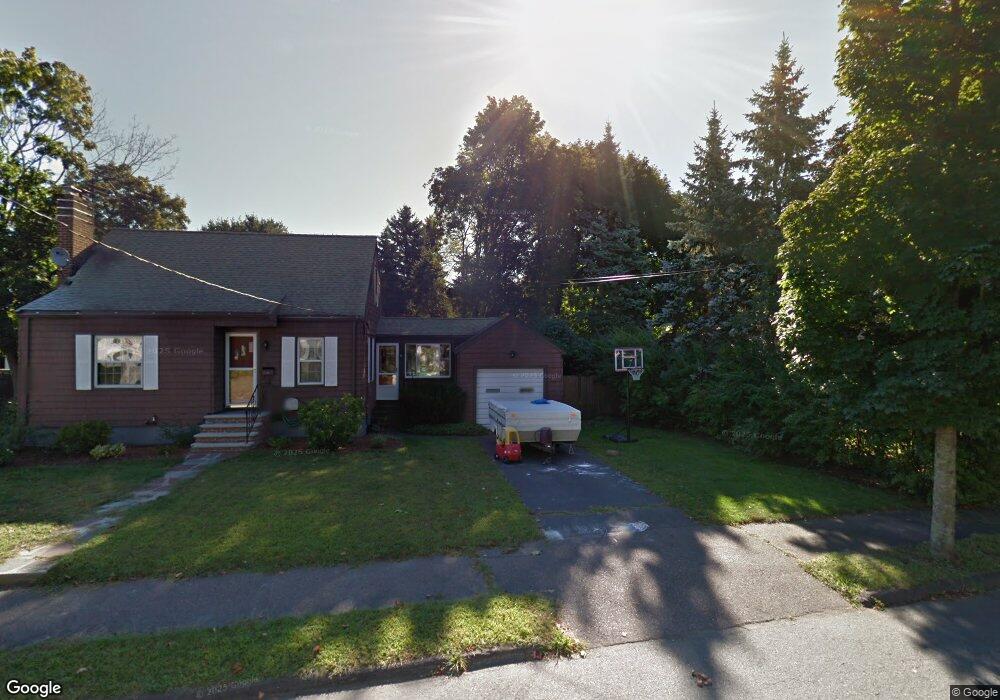
5 Paon Blvd Wakefield, MA 01880
Lakeside NeighborhoodEstimated Value: $642,000 - $675,000
3
Beds
1
Bath
954
Sq Ft
$686/Sq Ft
Est. Value
About This Home
This home is located at 5 Paon Blvd, Wakefield, MA 01880 and is currently estimated at $654,204, approximately $685 per square foot. 5 Paon Blvd is a home located in Middlesex County with nearby schools including Wakefield Memorial High School, St Joseph School, and Odyssey Day School.
Ownership History
Date
Name
Owned For
Owner Type
Purchase Details
Closed on
Sep 21, 2007
Sold by
Porcelain Veronica A and Hayes Veronica M
Bought by
Hayes Christopher R and Hayes Sherri L
Current Estimated Value
Home Financials for this Owner
Home Financials are based on the most recent Mortgage that was taken out on this home.
Original Mortgage
$224,000
Outstanding Balance
$142,257
Interest Rate
6.63%
Mortgage Type
Purchase Money Mortgage
Estimated Equity
$511,947
Create a Home Valuation Report for This Property
The Home Valuation Report is an in-depth analysis detailing your home's value as well as a comparison with similar homes in the area
Home Values in the Area
Average Home Value in this Area
Purchase History
| Date | Buyer | Sale Price | Title Company |
|---|---|---|---|
| Hayes Christopher R | $280,000 | -- |
Source: Public Records
Mortgage History
| Date | Status | Borrower | Loan Amount |
|---|---|---|---|
| Open | Hayes Christopher R | $224,000 |
Source: Public Records
Tax History Compared to Growth
Tax History
| Year | Tax Paid | Tax Assessment Tax Assessment Total Assessment is a certain percentage of the fair market value that is determined by local assessors to be the total taxable value of land and additions on the property. | Land | Improvement |
|---|---|---|---|---|
| 2025 | $7,123 | $627,600 | $395,500 | $232,100 |
| 2024 | $6,568 | $583,800 | $367,900 | $215,900 |
| 2023 | $6,392 | $544,900 | $343,400 | $201,500 |
| 2022 | $5,994 | $486,500 | $306,600 | $179,900 |
| 2021 | $5,787 | $454,600 | $280,300 | $174,300 |
| 2020 | $5,443 | $426,200 | $262,800 | $163,400 |
| 2019 | $5,104 | $397,800 | $245,300 | $152,500 |
| 2018 | $4,921 | $380,000 | $234,300 | $145,700 |
| 2017 | $4,628 | $355,200 | $219,000 | $136,200 |
| 2016 | $4,647 | $344,500 | $216,200 | $128,300 |
| 2015 | $4,339 | $321,900 | $202,000 | $119,900 |
| 2014 | $4,014 | $314,100 | $197,100 | $117,000 |
Source: Public Records
Map
Nearby Homes