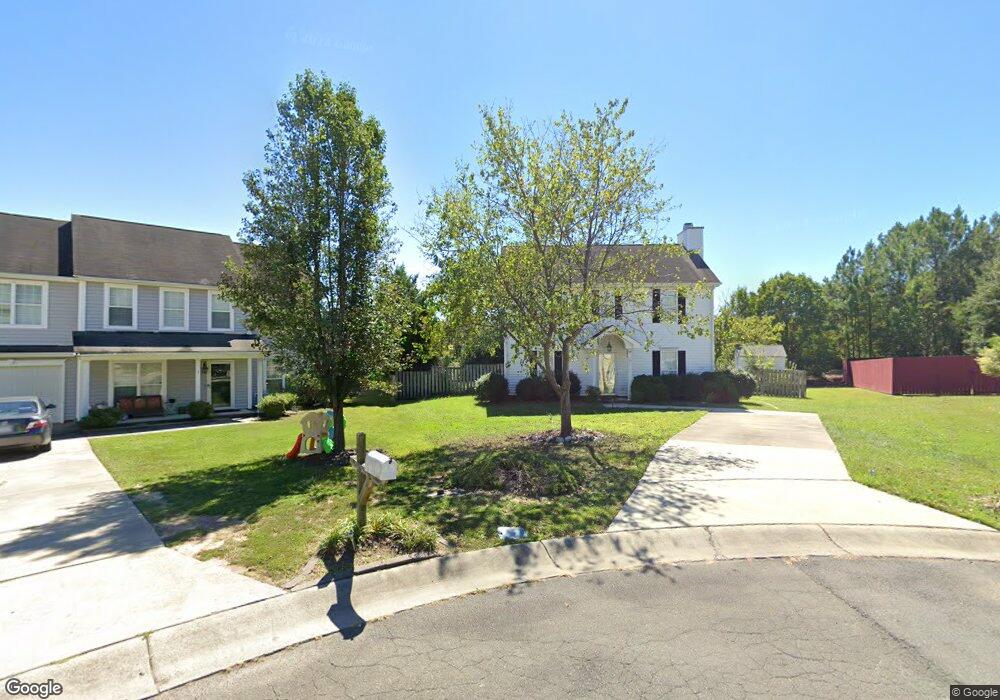
5 Perigrine Way Durham, NC 27703
Eastern Durham NeighborhoodEstimated Value: $322,000 - $352,000
3
Beds
3
Baths
1,547
Sq Ft
$220/Sq Ft
Est. Value
About This Home
This home is located at 5 Perigrine Way, Durham, NC 27703 and is currently estimated at $339,667, approximately $219 per square foot. 5 Perigrine Way is a home located in Durham County with nearby schools including Glenn Elementary, John W Neal Middle School, and Southern School of Energy & Sustainability.
Ownership History
Date
Name
Owned For
Owner Type
Purchase Details
Closed on
Jan 4, 2019
Sold by
Austin Holly A and Anderson Holly
Bought by
Smith Stephanie L
Current Estimated Value
Home Financials for this Owner
Home Financials are based on the most recent Mortgage that was taken out on this home.
Original Mortgage
$177,995
Outstanding Balance
$157,123
Interest Rate
4.8%
Mortgage Type
New Conventional
Estimated Equity
$182,544
Purchase Details
Closed on
May 23, 2006
Sold by
Parfitt Seth R and Parfitt Melissa T
Bought by
Anderson Holly
Home Financials for this Owner
Home Financials are based on the most recent Mortgage that was taken out on this home.
Original Mortgage
$29,280
Interest Rate
6.5%
Mortgage Type
Fannie Mae Freddie Mac
Purchase Details
Closed on
Mar 12, 2001
Sold by
Cimarron Capital Inc
Bought by
Parfitt Seth R and Parfitt Melissa T
Home Financials for this Owner
Home Financials are based on the most recent Mortgage that was taken out on this home.
Original Mortgage
$129,412
Interest Rate
7.02%
Mortgage Type
FHA
Create a Home Valuation Report for This Property
The Home Valuation Report is an in-depth analysis detailing your home's value as well as a comparison with similar homes in the area
Home Values in the Area
Average Home Value in this Area
Purchase History
| Date | Buyer | Sale Price | Title Company |
|---|---|---|---|
| Smith Stephanie L | $184,000 | None Available | |
| Anderson Holly | $146,500 | None Available | |
| Parfitt Seth R | $132,000 | -- |
Source: Public Records
Mortgage History
| Date | Status | Borrower | Loan Amount |
|---|---|---|---|
| Open | Smith Stephanie L | $177,995 | |
| Previous Owner | Anderson Holly | $29,280 | |
| Previous Owner | Anderson Holly | $117,120 | |
| Previous Owner | Parfitt Seth R | $129,412 |
Source: Public Records
Tax History
| Year | Tax Paid | Tax Assessment Tax Assessment Total Assessment is a certain percentage of the fair market value that is determined by local assessors to be the total taxable value of land and additions on the property. | Land | Improvement |
|---|---|---|---|---|
| 2025 | $3,227 | $325,576 | $57,660 | $267,916 |
| 2024 | $2,332 | $167,172 | $24,760 | $142,412 |
| 2023 | $2,190 | $167,172 | $24,760 | $142,412 |
| 2022 | $2,140 | $167,172 | $24,760 | $142,412 |
| 2021 | $2,130 | $167,172 | $24,760 | $142,412 |
| 2020 | $2,079 | $167,172 | $24,760 | $142,412 |
| 2019 | $2,079 | $167,172 | $24,760 | $142,412 |
| 2018 | $1,904 | $140,370 | $24,760 | $115,610 |
| 2017 | $1,890 | $140,370 | $24,760 | $115,610 |
| 2016 | $1,826 | $140,370 | $24,760 | $115,610 |
| 2015 | $2,023 | $146,112 | $30,306 | $115,806 |
| 2014 | $2,023 | $146,112 | $30,306 | $115,806 |
Source: Public Records
Map
Nearby Homes
- 5706 Wrenwood Ct Unit Lt 116
- 4317 Marbrey Dr
- 4505 Tyne Dr
- 2 Tarrywood Ct
- 7 Duxford Ct
- 914 Flanders Dr
- 107 Crosswood Dr
- 913 Valmet Dr
- 110 Kindlewood Dr
- 608 Chalcedony Ct
- 502 Quartz Dr
- 1034 Statler Dr
- 304 Stallings Rd
- 521 Quartz Dr
- 1060 Gentle Reed Dr
- 507 Lodestone Dr
- 1025 Sweet Cream Ct
- 3708 Thornwood Dr
- 715 Patterson Rd
- 1113 Homecoming Way
- 6 Perigrine Way
- 3 Perigrine Way
- 4 Sugar Maple Ct
- 6 Sugar Maple Ct
- 1 N Berrymeadow Ln
- 5701 Thistlerock Ln
- 4 Perigrine Way
- 9 Periwinkle Ct
- 7 Sugar Maple Ct
- 3 N Berrymeadow Ln
- 7 Periwinkle Ct
- 5706 Thistlerock Ln
- 5708 Wrenwood Ct
- 5706 Wrenwood Ct
- 8 Periwinkle Ct
- 5 N Berrymeadow Ln
- 5700 Thistlerock Ln
- 2 N Berrymeadow Ln
- 5 Sugar Maple Ct
- 3 Sugar Maple Ct
Your Personal Tour Guide
Ask me questions while you tour the home.