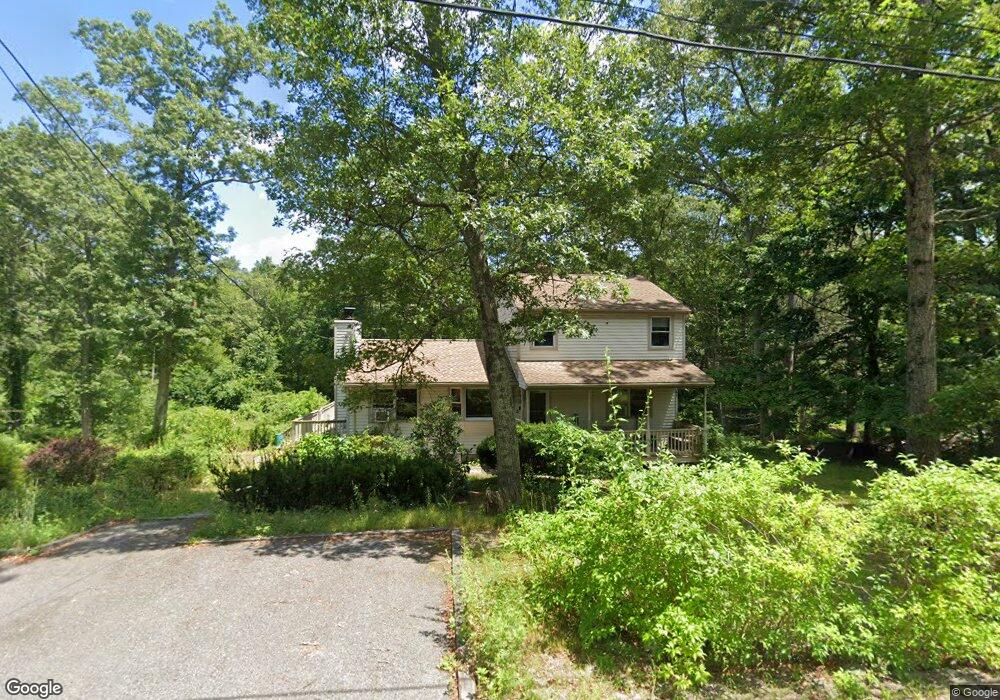
5 Pine St Rehoboth, MA 02769
Estimated Value: $500,000 - $673,000
4
Beds
1
Bath
1,872
Sq Ft
$304/Sq Ft
Est. Value
About This Home
This home is located at 5 Pine St, Rehoboth, MA 02769 and is currently estimated at $568,245, approximately $303 per square foot. 5 Pine St is a home located in Bristol County with nearby schools including Dighton-Rehoboth Regional High School, St Cecilia School, and St Margaret School.
Ownership History
Date
Name
Owned For
Owner Type
Purchase Details
Closed on
Oct 21, 1992
Sold by
Rosasco Stephen J and Cox Cheryl L
Bought by
Hester Robert E and Hester Lynn A
Current Estimated Value
Home Financials for this Owner
Home Financials are based on the most recent Mortgage that was taken out on this home.
Original Mortgage
$100,000
Interest Rate
7.79%
Mortgage Type
Purchase Money Mortgage
Purchase Details
Closed on
Jun 21, 1988
Sold by
Gray Michael C
Bought by
Rosasco Stephen J
Create a Home Valuation Report for This Property
The Home Valuation Report is an in-depth analysis detailing your home's value as well as a comparison with similar homes in the area
Home Values in the Area
Average Home Value in this Area
Purchase History
| Date | Buyer | Sale Price | Title Company |
|---|---|---|---|
| Hester Robert E | $145,000 | -- | |
| Rosasco Stephen J | $159,900 | -- |
Source: Public Records
Mortgage History
| Date | Status | Borrower | Loan Amount |
|---|---|---|---|
| Open | Rosasco Stephen J | $201,684 | |
| Closed | Rosasco Stephen J | $185,000 | |
| Closed | Rosasco Stephen J | $171,000 | |
| Closed | Rosasco Stephen J | $100,000 |
Source: Public Records
Tax History
| Year | Tax Paid | Tax Assessment Tax Assessment Total Assessment is a certain percentage of the fair market value that is determined by local assessors to be the total taxable value of land and additions on the property. | Land | Improvement |
|---|---|---|---|---|
| 2025 | $47 | $423,100 | $191,500 | $231,600 |
| 2024 | $4,746 | $417,800 | $191,500 | $226,300 |
| 2023 | $4,464 | $385,500 | $187,500 | $198,000 |
| 2022 | $4,374 | $345,200 | $179,100 | $166,100 |
| 2021 | $2,781 | $314,800 | $162,800 | $152,000 |
| 2020 | $2,662 | $314,800 | $162,800 | $152,000 |
| 2018 | $2,411 | $292,800 | $155,000 | $137,800 |
| 2017 | $3,455 | $275,100 | $155,000 | $120,100 |
| 2016 | $3,342 | $275,100 | $155,000 | $120,100 |
| 2015 | $3,214 | $261,100 | $147,800 | $113,300 |
| 2014 | $3,159 | $253,900 | $140,600 | $113,300 |
Source: Public Records
Map
Nearby Homes
Your Personal Tour Guide
Ask me questions while you tour the home.