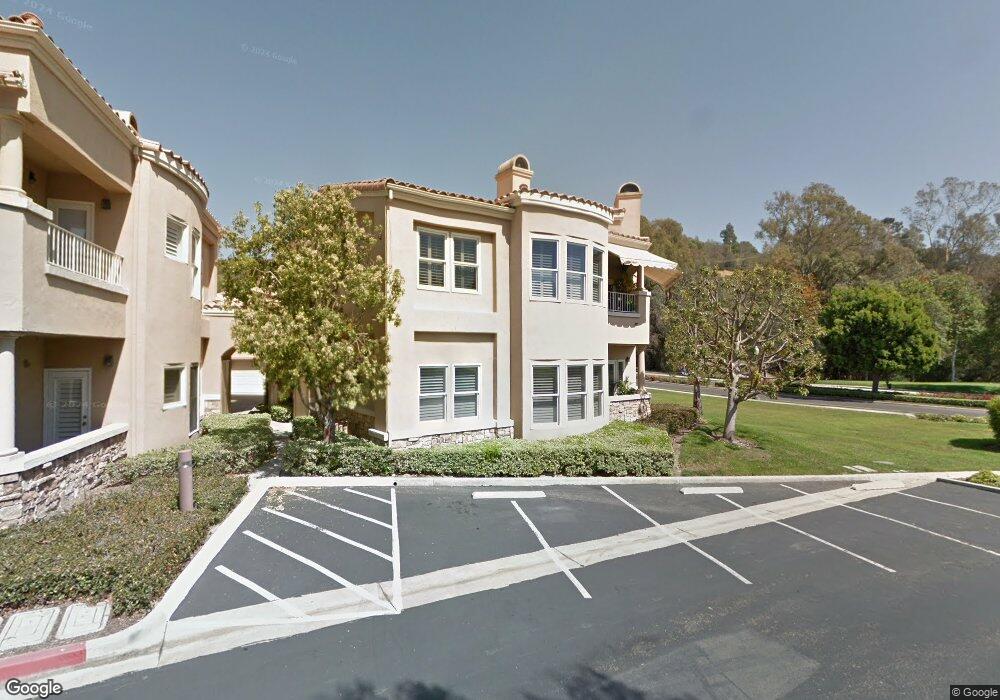
5 Plaza Baja Del Sol Unit 5 San Juan Capistrano, CA 92675
Estimated Value: $1,219,958 - $1,267,000
2
Beds
2
Baths
2,227
Sq Ft
$562/Sq Ft
Est. Value
About This Home
This home is located at 5 Plaza Baja Del Sol Unit 5, San Juan Capistrano, CA 92675 and is currently estimated at $1,250,490, approximately $561 per square foot. 5 Plaza Baja Del Sol Unit 5 is a home located in Orange County with nearby schools including Harold Ambuehl Elementary School, Marco Forster Middle School, and San Juan Hills High School.
Ownership History
Date
Name
Owned For
Owner Type
Purchase Details
Closed on
Apr 7, 2004
Sold by
Hansen Donald F and Walker Eva L
Bought by
Hansen Donald F and Walker Eva L
Current Estimated Value
Purchase Details
Closed on
Aug 6, 1999
Sold by
Walker Eva L
Bought by
Walker Eva L
Purchase Details
Closed on
Jul 15, 1997
Sold by
Hawthorne Svgs Fsb
Bought by
Walker Eva L and Hansen Donald F
Home Financials for this Owner
Home Financials are based on the most recent Mortgage that was taken out on this home.
Original Mortgage
$175,000
Interest Rate
7.45%
Create a Home Valuation Report for This Property
The Home Valuation Report is an in-depth analysis detailing your home's value as well as a comparison with similar homes in the area
Home Values in the Area
Average Home Value in this Area
Purchase History
| Date | Buyer | Sale Price | Title Company |
|---|---|---|---|
| Hansen Donald F | -- | -- | |
| Walker Eva L | -- | -- | |
| Walker Eva L | $345,000 | Continental Lawyers Title |
Source: Public Records
Mortgage History
| Date | Status | Borrower | Loan Amount |
|---|---|---|---|
| Previous Owner | Walker Eva L | $175,000 |
Source: Public Records
Tax History Compared to Growth
Tax History
| Year | Tax Paid | Tax Assessment Tax Assessment Total Assessment is a certain percentage of the fair market value that is determined by local assessors to be the total taxable value of land and additions on the property. | Land | Improvement |
|---|---|---|---|---|
| 2025 | $5,810 | $550,870 | $295,650 | $255,220 |
| 2024 | $5,810 | $540,069 | $289,853 | $250,216 |
| 2023 | $5,646 | $529,480 | $284,170 | $245,310 |
| 2022 | $5,288 | $519,099 | $278,599 | $240,500 |
| 2021 | $5,190 | $508,921 | $273,136 | $235,785 |
| 2020 | $5,143 | $503,703 | $270,335 | $233,368 |
| 2019 | $5,047 | $493,827 | $265,034 | $228,793 |
| 2018 | $4,955 | $484,145 | $259,838 | $224,307 |
| 2017 | $4,908 | $474,652 | $254,743 | $219,909 |
| 2016 | $4,817 | $465,346 | $249,748 | $215,598 |
| 2015 | $4,742 | $458,357 | $245,997 | $212,360 |
| 2014 | -- | $449,379 | $241,178 | $208,201 |
Source: Public Records
Map
Nearby Homes
- 30981 Via Mirador
- 90 Plaza de Las Flores
- 27381 Via Priorato
- 30532 Marbella Vista
- 27591 Rolling Wood Ln
- 27703 Ortega Hwy Unit 13
- 27703 Ortega Hwy Unit 127
- 30372 Marbella Vista
- 31261 Paseo Olivos
- 30431 Via Festivo
- 31121 Via Santo Tomas
- 30828 Calle Chueca
- 30932 Steeplechase Dr
- 27594 Starrise Ln
- 31278 Calle San Juan Unit 12
- 31024 Calle San Diego Unit 94b
- 31284 Calle San Juan Unit 14
- 27681 Paseo Esteban
- 26468 Calle San Antonio
- 27281 Viewpoint Cir
- 12 Plaza Baja Del Sol
- 18 Plaza Baja Del Sol
- 16 Plaza Baja Del Sol
- 8 Plaza Baja Del Sol
- 2 Plaza Baja Del Sol Unit 2
- 6 Plaza Baja Del Sol Unit 6
- 4 Plaza Baja Del Sol
- 9 Plaza Baja Del Sol
- 7 Plaza Baja Del Sol
- 11 Plaza Baja Del Sol
- 17 Plaza Baja Del Sol Unit 17
- 15 Plaza Baja Del Sol
- 1 Plaza Baja Del Sol
- 14 Plaza Baja Del Sol Unit 14
- 3 Plaza Baja Del Sol Unit 3
- 40 Plaza Caloroso Unit 40
- 38 Plaza Caloroso Unit 38
- 39 Plaza Caloroso
- 37 Plaza Caloroso
- 34 Plaza Caloroso