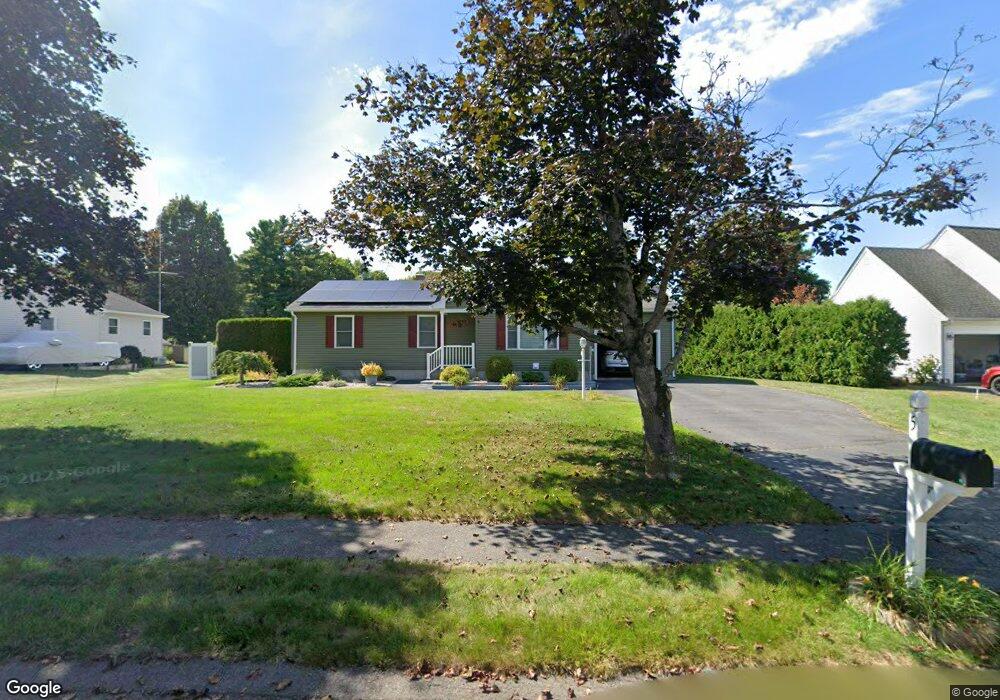
5 Plumbrook Dr Easthampton, MA 01027
Estimated Value: $498,000 - $560,000
3
Beds
3
Baths
1,651
Sq Ft
$312/Sq Ft
Est. Value
About This Home
This home is located at 5 Plumbrook Dr, Easthampton, MA 01027 and is currently estimated at $515,934, approximately $312 per square foot. 5 Plumbrook Dr is a home located in Hampshire County with nearby schools including Easthampton High School, Hilltown Cooperative Charter Public School, and Tri-County Schools.
Ownership History
Date
Name
Owned For
Owner Type
Purchase Details
Closed on
Aug 18, 2025
Sold by
Fleury Marc J and Fleury Kathy L
Bought by
Marc J & Kathy Fleury Ret and Fleury
Current Estimated Value
Purchase Details
Closed on
Sep 25, 1991
Sold by
Gruber Real Est Inc
Bought by
Fleury Mark J and Vanroekel Cathy L
Home Financials for this Owner
Home Financials are based on the most recent Mortgage that was taken out on this home.
Original Mortgage
$97,100
Interest Rate
9.1%
Mortgage Type
Purchase Money Mortgage
Create a Home Valuation Report for This Property
The Home Valuation Report is an in-depth analysis detailing your home's value as well as a comparison with similar homes in the area
Home Values in the Area
Average Home Value in this Area
Purchase History
| Date | Buyer | Sale Price | Title Company |
|---|---|---|---|
| Marc J & Kathy Fleury Ret | -- | -- | |
| Marc J & Kathy Fleury Ret | -- | -- | |
| Fleury Mark J | $107,900 | -- | |
| Fleury Mark J | $107,900 | -- |
Source: Public Records
Mortgage History
| Date | Status | Borrower | Loan Amount |
|---|---|---|---|
| Previous Owner | Fleury Mark J | $100,000 | |
| Previous Owner | Fleury Mark J | $90,600 | |
| Previous Owner | Fleury Mark J | $97,100 |
Source: Public Records
Tax History
| Year | Tax Paid | Tax Assessment Tax Assessment Total Assessment is a certain percentage of the fair market value that is determined by local assessors to be the total taxable value of land and additions on the property. | Land | Improvement |
|---|---|---|---|---|
| 2025 | $6,206 | $454,000 | $128,300 | $325,700 |
| 2024 | $6,021 | $444,000 | $124,500 | $319,500 |
| 2023 | $4,527 | $309,000 | $98,000 | $211,000 |
| 2022 | $5,108 | $309,000 | $98,000 | $211,000 |
| 2021 | $5,602 | $319,400 | $98,000 | $221,400 |
| 2020 | $5,488 | $309,000 | $98,000 | $211,000 |
| 2019 | $4,653 | $301,000 | $98,000 | $203,000 |
| 2018 | $4,486 | $280,400 | $92,400 | $188,000 |
| 2017 | $4,383 | $270,400 | $88,900 | $181,500 |
| 2016 | $4,332 | $277,900 | $88,900 | $189,000 |
| 2015 | $4,210 | $277,900 | $88,900 | $189,000 |
Source: Public Records
Map
Nearby Homes
- 2 Oak St
- 40 Clark St
- 33 Knipfer Ave
- 29 Parsons St Unit 1
- 18-20 Oakdale Place
- 12 Glen Cove Place Unit B
- 10 Glen Cove Place Unit A
- 4 Gaugh St
- 19 Nicols Way Unit 19
- 211 East St Unit 11
- 7 Union Ct
- 11 Dragon Cir
- 6 Wilton Rd
- 36 & 36R Holly Cir
- 41 South St Unit 11
- 6 S St & Abutting Lots
- 336 Main St
- 385 Main St
- 2 W Park Dr
- M143 &152 Glendale St
Your Personal Tour Guide
Ask me questions while you tour the home.