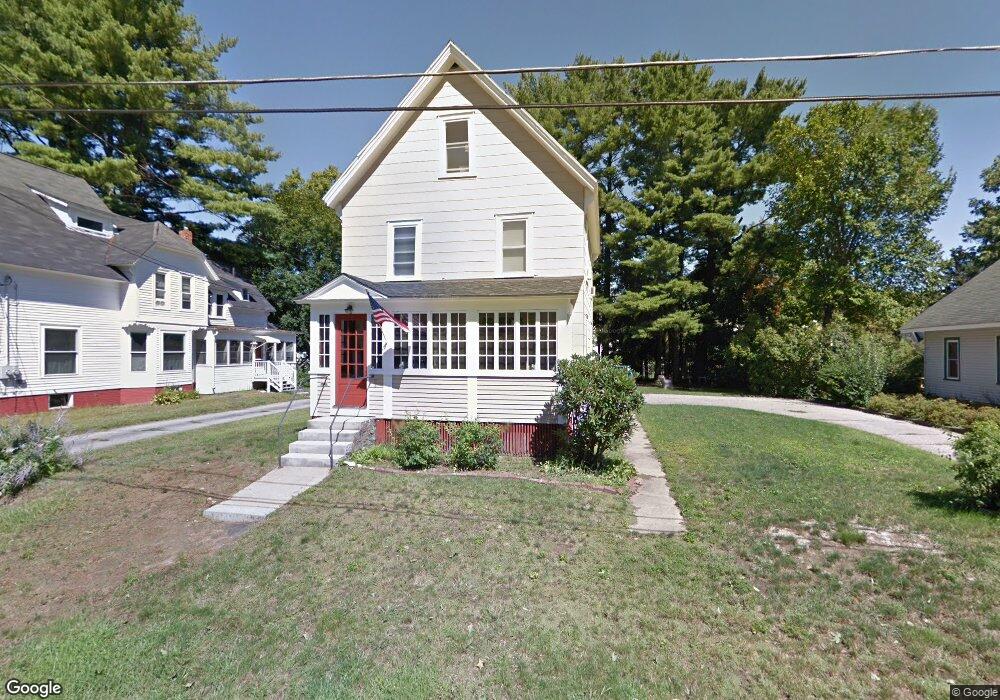
5 Princeton St Concord, NH 03301
South End NeighborhoodEstimated Value: $434,652 - $494,000
3
Beds
2
Baths
1,400
Sq Ft
$331/Sq Ft
Est. Value
About This Home
This home is located at 5 Princeton St, Concord, NH 03301 and is currently estimated at $463,413, approximately $331 per square foot. 5 Princeton St is a home located in Merrimack County with nearby schools including Abbot-Downing School, Rundlett Middle School, and Concord High School.
Ownership History
Date
Name
Owned For
Owner Type
Purchase Details
Closed on
Aug 13, 2008
Sold by
Mckenney Joyce C
Bought by
Vinovich Jonathan S and Vinovich Geralyn M
Current Estimated Value
Home Financials for this Owner
Home Financials are based on the most recent Mortgage that was taken out on this home.
Original Mortgage
$160,000
Interest Rate
6.4%
Mortgage Type
Purchase Money Mortgage
Purchase Details
Closed on
Sep 7, 2007
Sold by
Hubbs-Blandford Gloria
Bought by
Mckenney Joyce C
Home Financials for this Owner
Home Financials are based on the most recent Mortgage that was taken out on this home.
Original Mortgage
$136,000
Interest Rate
6.74%
Mortgage Type
Purchase Money Mortgage
Create a Home Valuation Report for This Property
The Home Valuation Report is an in-depth analysis detailing your home's value as well as a comparison with similar homes in the area
Home Values in the Area
Average Home Value in this Area
Purchase History
| Date | Buyer | Sale Price | Title Company |
|---|---|---|---|
| Vinovich Jonathan S | $220,000 | -- | |
| Mckenney Joyce C | $170,000 | -- |
Source: Public Records
Mortgage History
| Date | Status | Borrower | Loan Amount |
|---|---|---|---|
| Open | Mckenney Joyce C | $160,081 | |
| Closed | Mckenney Joyce C | $160,000 | |
| Previous Owner | Mckenney Joyce C | $136,000 | |
| Previous Owner | Mckenney Joyce C | $316,350 |
Source: Public Records
Tax History Compared to Growth
Tax History
| Year | Tax Paid | Tax Assessment Tax Assessment Total Assessment is a certain percentage of the fair market value that is determined by local assessors to be the total taxable value of land and additions on the property. | Land | Improvement |
|---|---|---|---|---|
| 2024 | $7,407 | $267,500 | $120,100 | $147,400 |
| 2023 | $7,185 | $267,500 | $120,100 | $147,400 |
| 2022 | $6,926 | $267,500 | $120,100 | $147,400 |
| 2021 | $7,358 | $292,900 | $120,100 | $172,800 |
| 2020 | $6,877 | $257,000 | $94,600 | $162,400 |
| 2019 | $6,370 | $229,300 | $98,300 | $131,000 |
| 2018 | $6,436 | $228,300 | $98,600 | $129,700 |
| 2017 | $6,210 | $219,900 | $98,600 | $121,300 |
| 2016 | $5,899 | $213,200 | $96,800 | $116,400 |
| 2015 | $5,607 | $190,400 | $87,500 | $102,900 |
| 2014 | $5,105 | $190,400 | $87,500 | $102,900 |
| 2013 | -- | $190,400 | $87,500 | $102,900 |
| 2012 | -- | $194,300 | $87,500 | $106,800 |
Source: Public Records
Map
Nearby Homes
- 12 Avon St
- 122 South St
- 0 South St Unit 4969509
- 47 South St
- 24 Pierce St
- 0 Spruce St Unit 88
- 33 Spruce St
- 22 Wilson Ave
- 14 Downing St
- 15 Wilson Ave
- 105 S Main St
- 14-16 Perley St
- 10 Perley St
- 2 Kensington Rd
- 87 S Main St Unit 2
- 1 Kensington Rd
- 54 Pleasant St Unit 8
- 4 Fayette St
- 376 S Main St
- 17 Essex St