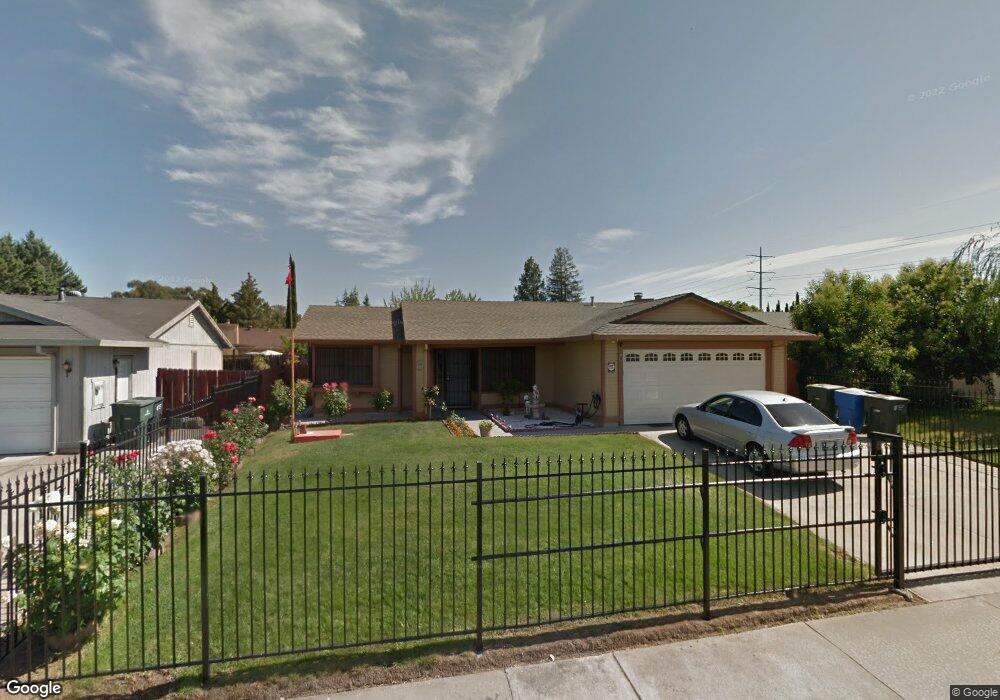
5 Pumice Ct Sacramento, CA 95823
Estimated Value: $272,000 - $496,000
4
Beds
2
Baths
1,599
Sq Ft
$262/Sq Ft
Est. Value
About This Home
This home is located at 5 Pumice Ct, Sacramento, CA 95823 and is currently estimated at $418,784, approximately $261 per square foot. 5 Pumice Ct is a home located in Sacramento County with nearby schools including Edward Kemble Elementary School, Cesar Chavez Intermediate School, and Fern Bacon Middle School.
Ownership History
Date
Name
Owned For
Owner Type
Purchase Details
Closed on
Aug 28, 2002
Sold by
Shoukat Mukhtar and Kokab Yasmeen
Bought by
Sharma Aniruth and Sharma Madhu K
Current Estimated Value
Home Financials for this Owner
Home Financials are based on the most recent Mortgage that was taken out on this home.
Original Mortgage
$184,300
Outstanding Balance
$77,718
Interest Rate
6.37%
Estimated Equity
$341,066
Purchase Details
Closed on
Jul 30, 1999
Sold by
Ha Thanh Singh Tac
Bought by
Shoukat Mukhtar and Kokab Yasmeen
Home Financials for this Owner
Home Financials are based on the most recent Mortgage that was taken out on this home.
Original Mortgage
$97,850
Interest Rate
7.64%
Purchase Details
Closed on
Feb 24, 1999
Sold by
Ha Tai Tac
Bought by
Ha Thanh Sing Tac
Create a Home Valuation Report for This Property
The Home Valuation Report is an in-depth analysis detailing your home's value as well as a comparison with similar homes in the area
Home Values in the Area
Average Home Value in this Area
Purchase History
| Date | Buyer | Sale Price | Title Company |
|---|---|---|---|
| Sharma Aniruth | $190,000 | Financial Title Company | |
| Shoukat Mukhtar | $103,000 | North American Title Guarant | |
| Ha Thanh Sing Tac | -- | -- |
Source: Public Records
Mortgage History
| Date | Status | Borrower | Loan Amount |
|---|---|---|---|
| Open | Sharma Aniruth | $184,300 | |
| Previous Owner | Shoukat Mukhtar | $97,850 |
Source: Public Records
Tax History Compared to Growth
Tax History
| Year | Tax Paid | Tax Assessment Tax Assessment Total Assessment is a certain percentage of the fair market value that is determined by local assessors to be the total taxable value of land and additions on the property. | Land | Improvement |
|---|---|---|---|---|
| 2025 | $3,380 | $275,160 | $28,956 | $246,204 |
| 2024 | $3,380 | $269,766 | $28,389 | $241,377 |
| 2023 | $3,293 | $264,478 | $27,833 | $236,645 |
| 2022 | $3,250 | $259,293 | $27,288 | $232,005 |
| 2021 | $3,093 | $254,209 | $26,753 | $227,456 |
| 2020 | $3,110 | $251,603 | $26,479 | $225,124 |
| 2019 | $3,043 | $246,670 | $25,960 | $220,710 |
| 2018 | $2,964 | $241,834 | $25,451 | $216,383 |
| 2017 | $2,917 | $237,093 | $24,952 | $212,141 |
| 2016 | $2,772 | $232,445 | $24,463 | $207,982 |
| 2015 | $2,725 | $228,954 | $24,096 | $204,858 |
| 2014 | $2,529 | $213,057 | $22,421 | $190,636 |
Source: Public Records
Map
Nearby Homes
- 39 Murata Ave
- 7495 Wainscott Way
- 7528 Georgica Way
- 130 Davis Ave
- 137 Davis Ave
- 214 Rodeo Dr
- 95 Bentley Ave
- 7508 Hither Way
- 61 Maple Dr
- 196 Amberglen Dr
- 152 Cooper Ave
- 3985 Limestone Way
- 7339 Alcedo Cir
- 1 Bentley Ave
- 2941 Gardendale Rd
- 3361 Jola Cir
- 7507 Mandy Dr
- 7585 Twilight Dr
- 7270 Meadowgate Dr
- 7637 Nixos Way