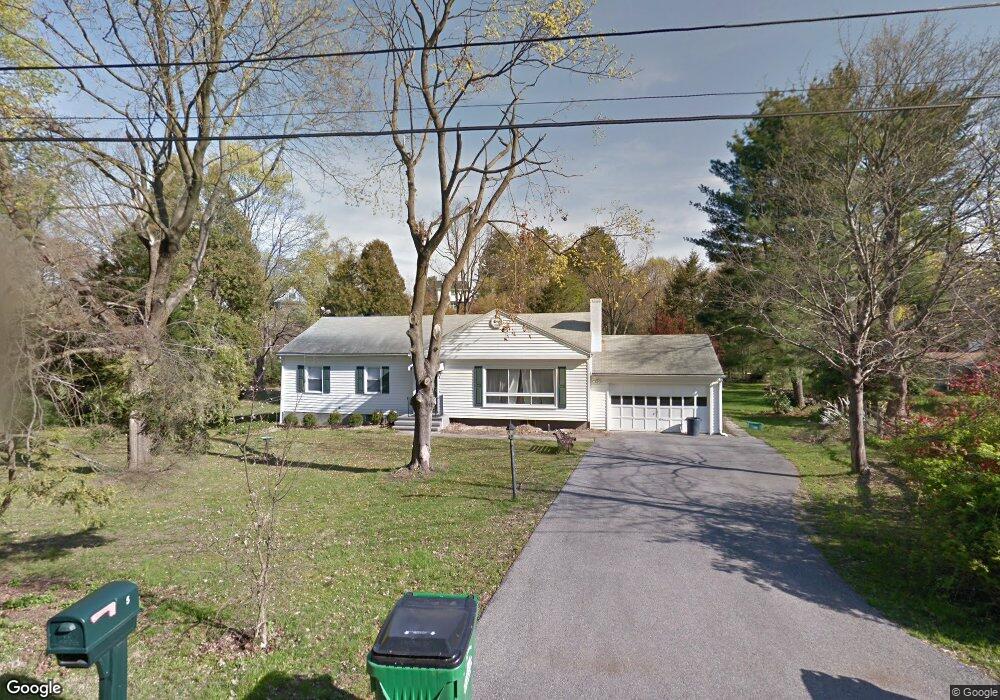
5 Pye Ln Poughkeepsie, NY 12603
Estimated Value: $416,299 - $457,000
3
Beds
2
Baths
1,326
Sq Ft
$329/Sq Ft
Est. Value
About This Home
This home is located at 5 Pye Ln, Poughkeepsie, NY 12603 and is currently estimated at $436,825, approximately $329 per square foot. 5 Pye Ln is a home located in Dutchess County with nearby schools including Spackenkill High School, Poughkeepsie Community Seventh-Day Adventist School, and Poughkeepsie Day School.
Ownership History
Date
Name
Owned For
Owner Type
Purchase Details
Closed on
Aug 28, 2009
Sold by
Sottile John
Bought by
Johnson Michael Richard
Current Estimated Value
Home Financials for this Owner
Home Financials are based on the most recent Mortgage that was taken out on this home.
Original Mortgage
$228,000
Outstanding Balance
$126,806
Interest Rate
5.17%
Mortgage Type
Purchase Money Mortgage
Estimated Equity
$310,019
Purchase Details
Closed on
Jul 20, 2001
Sold by
Sottile John J
Bought by
Boucher David G
Create a Home Valuation Report for This Property
The Home Valuation Report is an in-depth analysis detailing your home's value as well as a comparison with similar homes in the area
Home Values in the Area
Average Home Value in this Area
Purchase History
| Date | Buyer | Sale Price | Title Company |
|---|---|---|---|
| Johnson Michael Richard | $240,000 | -- | |
| Boucher David G | $178,750 | Craig Wallace |
Source: Public Records
Mortgage History
| Date | Status | Borrower | Loan Amount |
|---|---|---|---|
| Open | Johnson Michael Richard | $228,000 |
Source: Public Records
Tax History
| Year | Tax Paid | Tax Assessment Tax Assessment Total Assessment is a certain percentage of the fair market value that is determined by local assessors to be the total taxable value of land and additions on the property. | Land | Improvement |
|---|---|---|---|---|
| 2024 | $10,973 | $345,500 | $84,600 | $260,900 |
| 2023 | $24,306 | $345,500 | $84,600 | $260,900 |
| 2019 | $7,461 | $219,500 | $76,900 | $142,600 |
Source: Public Records
Map
Nearby Homes
- 220 Wilbur Blvd
- 42 Beechwood Park
- 16 Kingwood Ln
- 45 Old Farms Rd
- 174 Cedar Ave
- 17 Santa Anna Dr
- 2710 South Rd Unit B5
- 2710 South Rd Unit A4
- 75 Beechwood Ave
- 102 Cedar Ave
- 2740 South Rd Unit G11
- 2343 South Rd
- 90 Cedar Ave
- 14 Bellmore Dr
- 26 Antoinette Dr
- 1907 Magnolia Walk
- 2202 Mulberry Ct
- 1202 Fox Ln
- 908 Scenic Ln
- 50 Mitchell Ave
Your Personal Tour Guide
Ask me questions while you tour the home.