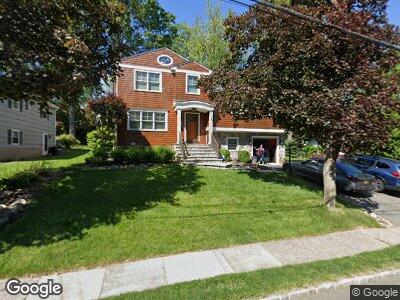
5 Raymond St Chatham, NJ 07928
Estimated Value: $1,109,000 - $1,349,174
--
Bed
--
Bath
1,524
Sq Ft
$803/Sq Ft
Est. Value
About This Home
This home is located at 5 Raymond St, Chatham, NJ 07928 and is currently estimated at $1,223,044, approximately $802 per square foot. 5 Raymond St is a home located in Morris County with nearby schools including Chatham High School, St. Patrick School, and ECLC of New Jersey.
Ownership History
Date
Name
Owned For
Owner Type
Purchase Details
Closed on
Jul 20, 2007
Sold by
Fontana Leo J and Fontana Margaret M
Bought by
Sachs Neil and Sachs Teresa
Current Estimated Value
Home Financials for this Owner
Home Financials are based on the most recent Mortgage that was taken out on this home.
Original Mortgage
$565,000
Interest Rate
6.78%
Mortgage Type
Purchase Money Mortgage
Purchase Details
Closed on
Aug 1, 2002
Sold by
Mcmorrow Dave
Bought by
Fontana Leo and Fontana Margaret
Home Financials for this Owner
Home Financials are based on the most recent Mortgage that was taken out on this home.
Original Mortgage
$327,000
Interest Rate
6.58%
Purchase Details
Closed on
Oct 17, 1996
Sold by
Aramburu Jose A and Aramburu Miren B
Bought by
Mcmorrow David P and Mcmorrow Theresa F
Home Financials for this Owner
Home Financials are based on the most recent Mortgage that was taken out on this home.
Original Mortgage
$180,000
Interest Rate
6.75%
Create a Home Valuation Report for This Property
The Home Valuation Report is an in-depth analysis detailing your home's value as well as a comparison with similar homes in the area
Home Values in the Area
Average Home Value in this Area
Purchase History
| Date | Buyer | Sale Price | Title Company |
|---|---|---|---|
| Sachs Neil | $607,000 | Chicago Title Insurance Co | |
| Fontana Leo | $465,000 | -- | |
| Mcmorrow David P | $230,000 | -- |
Source: Public Records
Mortgage History
| Date | Status | Borrower | Loan Amount |
|---|---|---|---|
| Open | Sachs Neil | $720,000 | |
| Closed | Sachs Nell | $880,000 | |
| Closed | Sachs Neil A | $768,000 | |
| Closed | Sachs Neil A | $768,000 | |
| Closed | Sachs Neil | $565,000 | |
| Previous Owner | Fontana Margaret M | $223,000 | |
| Previous Owner | Fontana Leo | $327,000 | |
| Previous Owner | Mcmorrow David P | $180,000 |
Source: Public Records
Tax History Compared to Growth
Tax History
| Year | Tax Paid | Tax Assessment Tax Assessment Total Assessment is a certain percentage of the fair market value that is determined by local assessors to be the total taxable value of land and additions on the property. | Land | Improvement |
|---|---|---|---|---|
| 2024 | $16,510 | $1,062,400 | $591,300 | $471,100 |
| 2023 | $16,510 | $1,062,400 | $591,300 | $471,100 |
| 2022 | $15,128 | $707,900 | $403,600 | $304,300 |
| 2021 | $15,000 | $707,900 | $403,600 | $304,300 |
| 2020 | $15,000 | $707,900 | $403,600 | $304,300 |
| 2019 | $14,894 | $707,900 | $403,600 | $304,300 |
| 2018 | $14,477 | $707,900 | $403,600 | $304,300 |
| 2017 | $14,059 | $707,900 | $403,600 | $304,300 |
| 2016 | $10,426 | $539,100 | $403,600 | $135,500 |
| 2015 | $10,302 | $539,100 | $403,600 | $135,500 |
| 2014 | $10,227 | $539,100 | $403,600 | $135,500 |
Source: Public Records
Map
Nearby Homes
- 29 Red Rd
- 84 Fairmount Ave
- 128 Fairmount Ave
- 11 Oliver St
- 70 Fairmount Ave
- 38 Summit Ave
- 36 Minton Ave
- 147 Watchung Ave
- 36 Tallmadge Ave
- 133 Washington Ave
- 80 Washington Ave
- 12 N Hillside Ave
- 148 Washington Ave
- 26 Miele Place
- 62 Lincoln Ave
- 30 Lewis Ave
- 38 Miele Place
- 19 Coleman Ave E
- 23 Aubrey St
- 46 N Summit Ave
- 5 Raymond St
- 7 Raymond St
- 3 Raymond St
- 109 Hillside Ave
- 119 Hillside Ave
- 8 Raymond St
- 107 Hillside Ave
- 26 Pihlman Place
- 121 Hillside Ave
- 24 Pihlman Place
- 10 Raymond St
- 18 Pihlman Place
- 114 Hillside Ave
- 112 Hillside Ave
- 123 Hillside Ave
- 116 Hillside Ave
- 108 Hillside Ave
- 120 Hillside Ave
- 118 Hillside Ave
- 16 Pihlman Place