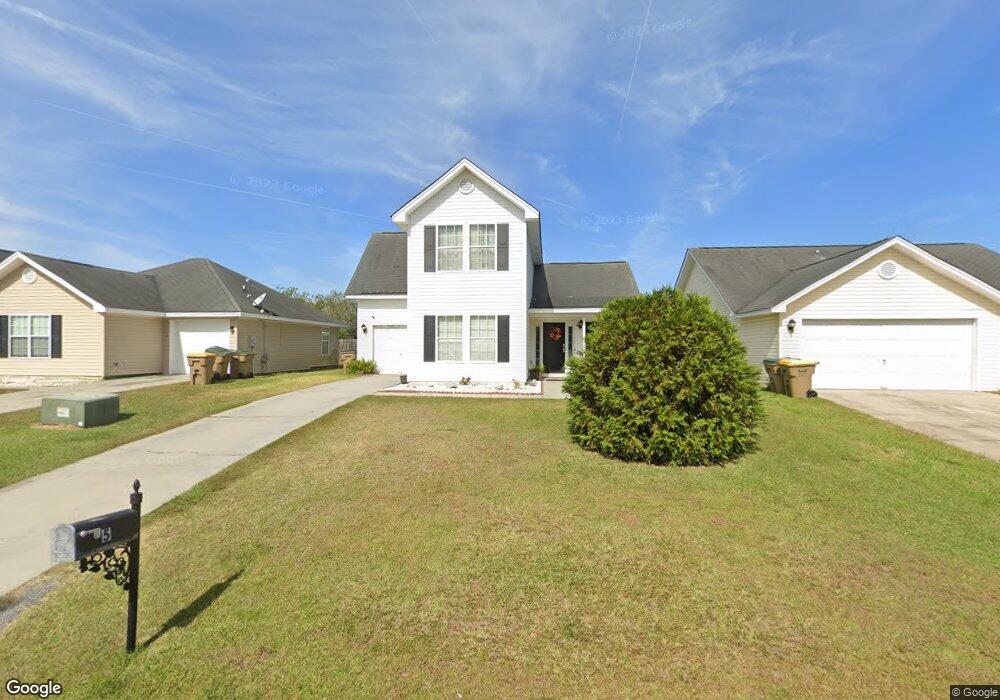
5 Rostrum Ln Savannah, GA 31407
Estimated Value: $262,000 - $288,000
4
Beds
2
Baths
1,630
Sq Ft
$170/Sq Ft
Est. Value
About This Home
This home is located at 5 Rostrum Ln, Savannah, GA 31407 and is currently estimated at $276,445, approximately $169 per square foot. 5 Rostrum Ln is a home located in Chatham County with nearby schools including Rice Creek K-8 School and Groves High School.
Ownership History
Date
Name
Owned For
Owner Type
Purchase Details
Closed on
Jan 4, 2008
Sold by
Not Provided
Bought by
Terrel Davis and Terrel Mike
Current Estimated Value
Home Financials for this Owner
Home Financials are based on the most recent Mortgage that was taken out on this home.
Original Mortgage
$130,539
Outstanding Balance
$81,449
Interest Rate
5.94%
Mortgage Type
FHA
Estimated Equity
$194,996
Purchase Details
Closed on
Mar 1, 2005
Sold by
Rande Duke Construction Inc
Bought by
Fitzgerald Gerry R
Home Financials for this Owner
Home Financials are based on the most recent Mortgage that was taken out on this home.
Original Mortgage
$120,419
Interest Rate
5.6%
Mortgage Type
VA
Purchase Details
Closed on
Dec 13, 2004
Sold by
New City Development Llc
Bought by
Rande Duke Construction Inc
Create a Home Valuation Report for This Property
The Home Valuation Report is an in-depth analysis detailing your home's value as well as a comparison with similar homes in the area
Home Values in the Area
Average Home Value in this Area
Purchase History
| Date | Buyer | Sale Price | Title Company |
|---|---|---|---|
| Terrel Davis | $142,900 | -- | |
| Fitzgerald Gerry R | $117,885 | -- | |
| Rande Duke Construction Inc | -- | -- |
Source: Public Records
Mortgage History
| Date | Status | Borrower | Loan Amount |
|---|---|---|---|
| Open | Terrel Davis | $130,539 | |
| Previous Owner | Fitzgerald Gerry R | $120,419 |
Source: Public Records
Tax History
| Year | Tax Paid | Tax Assessment Tax Assessment Total Assessment is a certain percentage of the fair market value that is determined by local assessors to be the total taxable value of land and additions on the property. | Land | Improvement |
|---|---|---|---|---|
| 2025 | $1,907 | $102,560 | $20,000 | $82,560 |
| 2024 | $12 | $91,840 | $18,000 | $73,840 |
| 2023 | $1,245 | $84,960 | $18,000 | $66,960 |
| 2022 | $1,595 | $68,320 | $8,000 | $60,320 |
| 2021 | $1,588 | $60,000 | $8,000 | $52,000 |
| 2020 | $1,420 | $58,440 | $8,000 | $50,440 |
| 2019 | $1,420 | $50,960 | $8,000 | $42,960 |
| 2018 | $1,367 | $49,320 | $8,000 | $41,320 |
| 2017 | $1,267 | $49,520 | $8,000 | $41,520 |
| 2016 | $1,035 | $42,440 | $8,000 | $34,440 |
| 2015 | $1,052 | $42,880 | $8,000 | $34,880 |
| 2014 | -- | $43,280 | $0 | $0 |
Source: Public Records
Map
Nearby Homes
- 5 Stemson Way
- 39 Bearing Cir
- 19 Halyard Dr
- 10 Binnacle Ln
- 58 Bearing Cir Unit D
- 33 Cordage Cir
- 24 Transom Rd
- 7 Corsair Cir
- 33 Gimbal Cir
- 76 Tiller Way
- 0 Highway 30 Unit SA345863
- 150 Berrien Rd
- 5 Ponderosa Dr
- Lot 6 Raley Rd
- Lot 5 Raley Rd
- 217 Monteith Rd
- 135 Monteith Rd
- 615 Meinhard Rd
- 44 Braxton Manor Dr
- 15 Amber Dr
Your Personal Tour Guide
Ask me questions while you tour the home.