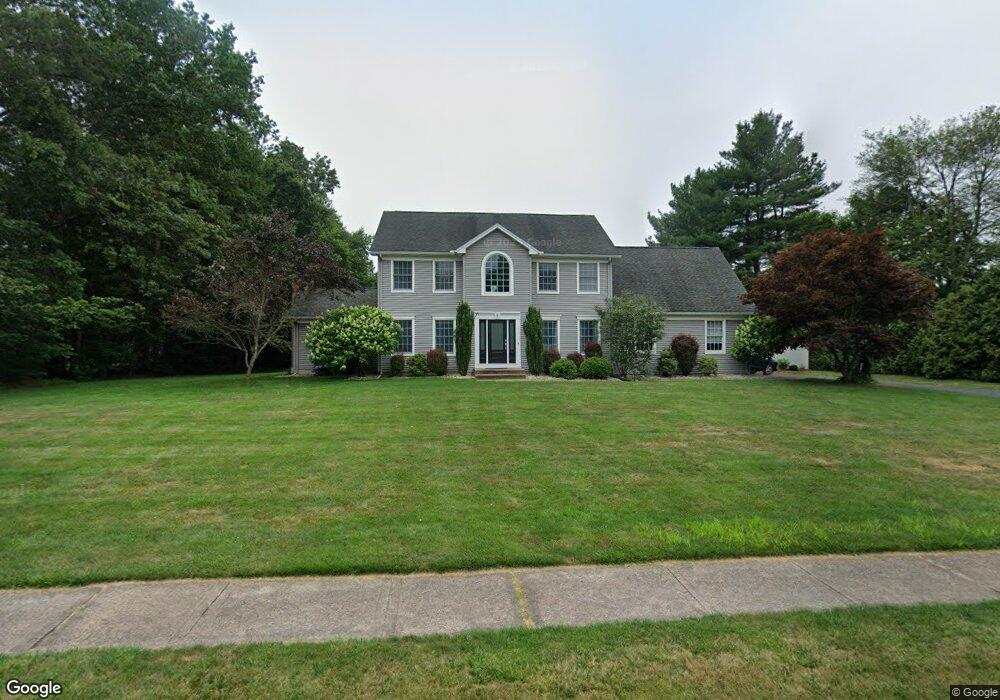
5 Royal Oak Ln Suffield, CT 06078
Estimated Value: $762,000 - $848,000
4
Beds
3
Baths
2,799
Sq Ft
$283/Sq Ft
Est. Value
About This Home
This home is located at 5 Royal Oak Ln, Suffield, CT 06078 and is currently estimated at $792,838, approximately $283 per square foot. 5 Royal Oak Ln is a home located in Hartford County with nearby schools including A. Ward Spaulding School, Mcalister Intermediate School, and Suffield Middle School.
Ownership History
Date
Name
Owned For
Owner Type
Purchase Details
Closed on
Jun 30, 2011
Sold by
Manning Peter T
Bought by
Lynam Patrick J and Lynam Pamela L
Current Estimated Value
Home Financials for this Owner
Home Financials are based on the most recent Mortgage that was taken out on this home.
Original Mortgage
$372,000
Outstanding Balance
$257,250
Interest Rate
4.62%
Mortgage Type
Purchase Money Mortgage
Estimated Equity
$535,588
Purchase Details
Closed on
Aug 5, 2009
Sold by
Manning Gina
Bought by
Manning Peter
Home Financials for this Owner
Home Financials are based on the most recent Mortgage that was taken out on this home.
Original Mortgage
$25,000
Interest Rate
5.28%
Purchase Details
Closed on
Feb 25, 2002
Sold by
Cvoli Gregory and Cavoli Andrea
Bought by
Manning Gina and Peter Manning T
Purchase Details
Closed on
Jun 26, 2000
Sold by
Briarwood Homes Inc
Bought by
Cavoli Gregory and Corrano Andrea
Create a Home Valuation Report for This Property
The Home Valuation Report is an in-depth analysis detailing your home's value as well as a comparison with similar homes in the area
Home Values in the Area
Average Home Value in this Area
Purchase History
| Date | Buyer | Sale Price | Title Company |
|---|---|---|---|
| Lynam Patrick J | $465,000 | -- | |
| Manning Peter | -- | -- | |
| Manning Gina | $375,000 | -- | |
| Cavoli Gregory | $329,900 | -- |
Source: Public Records
Mortgage History
| Date | Status | Borrower | Loan Amount |
|---|---|---|---|
| Open | Cavoli Gregory | $30,000 | |
| Open | Cavoli Gregory | $372,000 | |
| Previous Owner | Cavoli Gregory | $25,000 |
Source: Public Records
Tax History
| Year | Tax Paid | Tax Assessment Tax Assessment Total Assessment is a certain percentage of the fair market value that is determined by local assessors to be the total taxable value of land and additions on the property. | Land | Improvement |
|---|---|---|---|---|
| 2025 | $10,960 | $468,160 | $103,810 | $364,350 |
| 2024 | $10,594 | $468,160 | $103,810 | $364,350 |
| 2023 | $9,655 | $337,470 | $103,810 | $233,660 |
| 2022 | $9,655 | $337,470 | $103,810 | $233,660 |
| 2021 | $9,665 | $337,470 | $103,810 | $233,660 |
| 2020 | $9,665 | $337,470 | $103,810 | $233,660 |
| 2019 | $9,692 | $337,470 | $103,810 | $233,660 |
| 2018 | $9,453 | $322,420 | $93,800 | $228,620 |
| 2017 | $9,315 | $322,420 | $93,800 | $228,620 |
| 2016 | $8,731 | $309,610 | $93,800 | $215,810 |
| 2015 | $8,601 | $309,610 | $93,800 | $215,810 |
| 2014 | $8,397 | $309,610 | $93,800 | $215,810 |
Source: Public Records
Map
Nearby Homes
- Lot 54 North St
- 0 Hickory St Unit 24099336
- 45 Douglas St
- 3 Martin St
- 278 Thompsonville Rd
- 20 Manning Rd
- 39 Union Street Extension
- 35 Bernardino Ave
- 9 Virginia Ave
- 30 Church St
- 26 Church St
- 98 1st St
- 42 Hartford Ave
- 120 2nd St
- 60 Lincoln St
- 57 Asnuntuck St
- 178 Brookfield Ln Unit 178
- 9 Eleanor Rd
- 420 Halladay Ave W
- 80 S River St
- 1324 Mapleton Ave
- 7 Royal Oak Ln
- 1338 Mapleton Ave
- 8 Meadow Wood Dr
- 1308 Mapleton Ave
- 10 Meadow Wood Dr
- 1352 Mapleton Ave
- 6 Meadow Wood Dr
- 4 Woodbridge Dr
- 8 Royal Oak Ln
- 12 Meadow Wood Dr
- 4 Meadow Wood Dr
- 8 Royel Oak Ln
- 1364 Mapleton Ave
- 9 Royal Oak Ln
- 1351 Mapleton Ave
- 7 Meadow Wood Dr
- 1359 Mapleton Ave
- 14 Meadow Wood Dr
- 9 Meadow Wood Dr
Your Personal Tour Guide
Ask me questions while you tour the home.