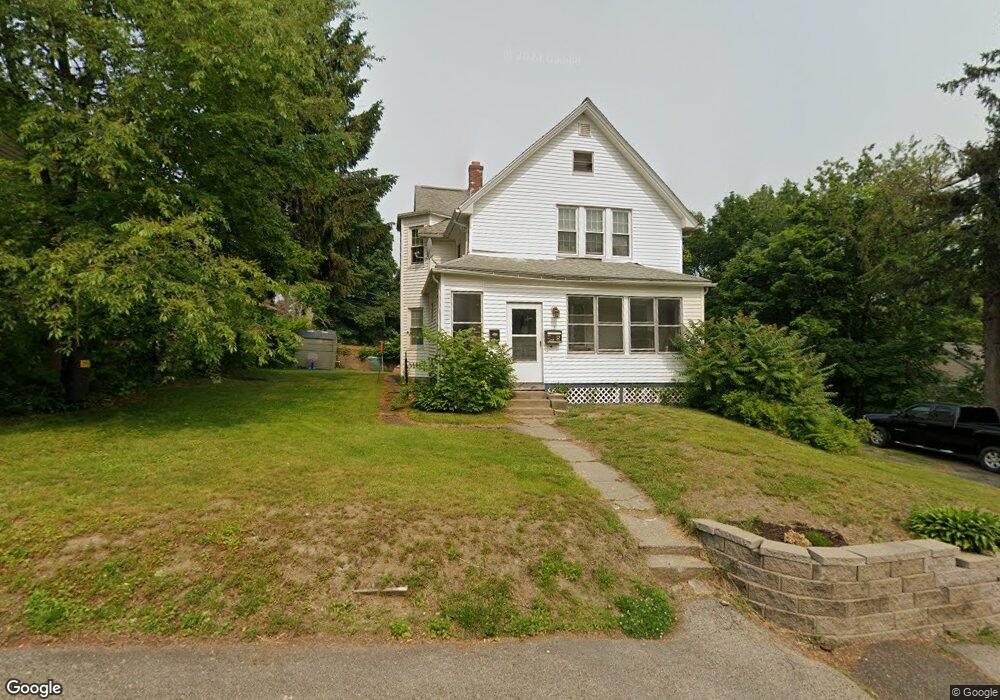
5 S Stowell St Worcester, MA 01604
Vernon Hill NeighborhoodEstimated Value: $404,000 - $537,000
4
Beds
2
Baths
1,873
Sq Ft
$255/Sq Ft
Est. Value
About This Home
This home is located at 5 S Stowell St, Worcester, MA 01604 and is currently estimated at $477,432, approximately $254 per square foot. 5 S Stowell St is a home located in Worcester County with nearby schools including Jacob Hiatt Magnet School, Chandler Magnet, and Rice Square Elementary School.
Ownership History
Date
Name
Owned For
Owner Type
Purchase Details
Closed on
Aug 17, 2006
Sold by
Yesket Anthony J and Yesket Theresa E
Bought by
Yesket Anthony J and Yesket Theresa E
Current Estimated Value
Purchase Details
Closed on
Jul 23, 2003
Sold by
Yesket Anthony J
Bought by
Yesket Anthony J and Yesket Theresa E
Create a Home Valuation Report for This Property
The Home Valuation Report is an in-depth analysis detailing your home's value as well as a comparison with similar homes in the area
Home Values in the Area
Average Home Value in this Area
Purchase History
| Date | Buyer | Sale Price | Title Company |
|---|---|---|---|
| Yesket Anthony J | -- | -- | |
| Yesket Anthony J | -- | -- |
Source: Public Records
Tax History
| Year | Tax Paid | Tax Assessment Tax Assessment Total Assessment is a certain percentage of the fair market value that is determined by local assessors to be the total taxable value of land and additions on the property. | Land | Improvement |
|---|---|---|---|---|
| 2025 | $4,942 | $374,700 | $98,500 | $276,200 |
| 2024 | $4,751 | $345,500 | $98,500 | $247,000 |
| 2023 | $4,431 | $309,000 | $85,700 | $223,300 |
| 2022 | $4,248 | $279,300 | $68,600 | $210,700 |
| 2021 | $3,723 | $228,700 | $54,900 | $173,800 |
| 2020 | $3,494 | $205,500 | $54,500 | $151,000 |
| 2019 | $3,568 | $198,200 | $47,600 | $150,600 |
| 2018 | $3,493 | $184,700 | $47,600 | $137,100 |
| 2017 | $3,312 | $172,300 | $47,600 | $124,700 |
| 2016 | $3,213 | $155,900 | $34,000 | $121,900 |
| 2015 | $3,129 | $155,900 | $34,000 | $121,900 |
| 2014 | $3,046 | $155,900 | $34,000 | $121,900 |
Source: Public Records
Map
Nearby Homes
- 7 S Stowell St
- 54 Heywood St
- 1 S Stowell St
- 56 Heywood St
- 50 Heywood St
- 11 S Stowell St
- 11 S Stowell St Unit A
- 11 S Stowell St Unit B
- 6 S Stowell St
- 15 S Stowell St
- 46 Heywood St
- 64 Heywood St
- 9 Kenberma Rd
- 3 Jones St
- 59 Heywood St
- 7 Jones St
- 5 Jones St
- 16 S Stowell St
- 20-A (1) Rice Ln
- 11 Kenberma Rd
Your Personal Tour Guide
Ask me questions while you tour the home.