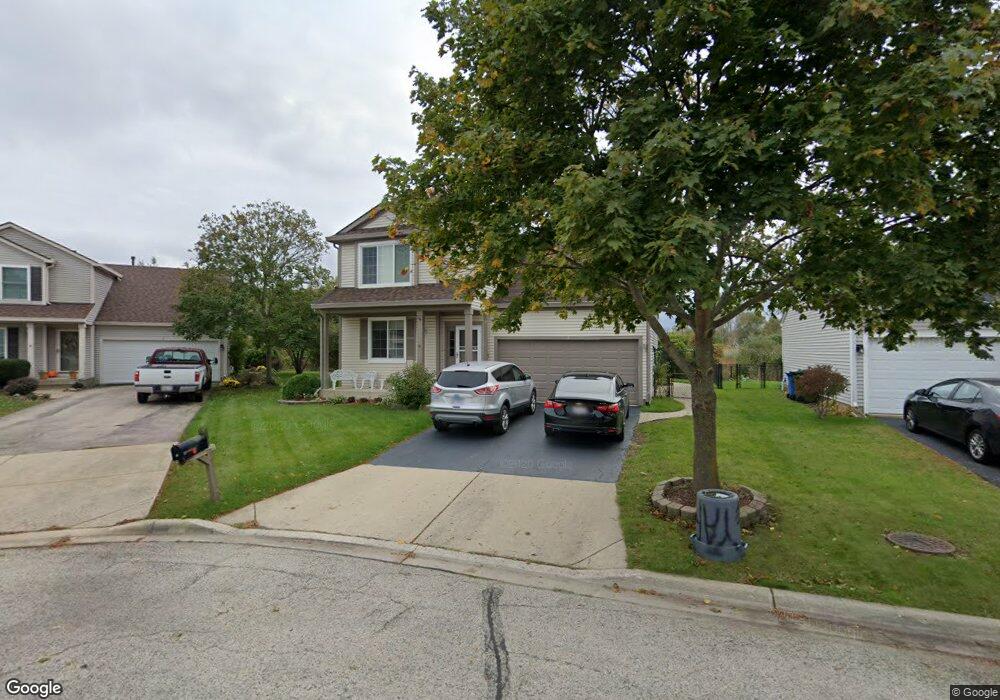
5 Sara Ct South Elgin, IL 60177
Estimated Value: $381,000 - $402,922
3
Beds
3
Baths
1,734
Sq Ft
$226/Sq Ft
Est. Value
About This Home
This home is located at 5 Sara Ct, South Elgin, IL 60177 and is currently estimated at $391,731, approximately $225 per square foot. 5 Sara Ct is a home located in Kane County with nearby schools including Fox Meadow Elementary School, Kenyon Woods Middle School, and South Elgin High School.
Ownership History
Date
Name
Owned For
Owner Type
Purchase Details
Closed on
Apr 29, 2005
Sold by
Theine Joseph K and Theine Ann E
Bought by
Othman Yassen
Current Estimated Value
Home Financials for this Owner
Home Financials are based on the most recent Mortgage that was taken out on this home.
Original Mortgage
$50,400
Interest Rate
5.75%
Mortgage Type
Stand Alone Second
Purchase Details
Closed on
Sep 16, 2002
Sold by
Stephenson Leonard and Stephenson Karen M
Bought by
Theine Joseph K and Theine Ann E
Home Financials for this Owner
Home Financials are based on the most recent Mortgage that was taken out on this home.
Original Mortgage
$213,417
Interest Rate
5.37%
Purchase Details
Closed on
Aug 15, 1996
Sold by
Sundance Holdings Inc
Bought by
Stephenson Leonard and Krisch Karen M
Home Financials for this Owner
Home Financials are based on the most recent Mortgage that was taken out on this home.
Original Mortgage
$143,850
Interest Rate
8.3%
Create a Home Valuation Report for This Property
The Home Valuation Report is an in-depth analysis detailing your home's value as well as a comparison with similar homes in the area
Home Values in the Area
Average Home Value in this Area
Purchase History
| Date | Buyer | Sale Price | Title Company |
|---|---|---|---|
| Othman Yassen | $252,000 | Professional National Title | |
| Theine Joseph K | $225,000 | First American Title Co | |
| Stephenson Leonard | $160,000 | Ticor Title Insurance |
Source: Public Records
Mortgage History
| Date | Status | Borrower | Loan Amount |
|---|---|---|---|
| Previous Owner | Othman Yassen | $50,400 | |
| Previous Owner | Theine Joseph K | $213,417 | |
| Previous Owner | Stephenson Leonard | $143,850 |
Source: Public Records
Tax History Compared to Growth
Tax History
| Year | Tax Paid | Tax Assessment Tax Assessment Total Assessment is a certain percentage of the fair market value that is determined by local assessors to be the total taxable value of land and additions on the property. | Land | Improvement |
|---|---|---|---|---|
| 2024 | $9,043 | $122,596 | $32,132 | $90,464 |
| 2023 | $8,621 | $110,756 | $29,029 | $81,727 |
| 2022 | $8,174 | $100,990 | $26,469 | $74,521 |
| 2021 | $7,700 | $94,419 | $24,747 | $69,672 |
| 2020 | $7,470 | $90,138 | $23,625 | $66,513 |
| 2019 | $7,196 | $85,862 | $22,504 | $63,358 |
| 2018 | $7,058 | $80,887 | $21,200 | $59,687 |
| 2017 | $6,710 | $76,468 | $20,042 | $56,426 |
| 2016 | $6,393 | $70,942 | $18,594 | $52,348 |
| 2015 | -- | $63,000 | $15,018 | $47,982 |
| 2014 | -- | $57,837 | $14,833 | $43,004 |
| 2013 | -- | $59,362 | $15,224 | $44,138 |
Source: Public Records
Map
Nearby Homes
- 1436 Marleigh Ln
- 1370 Marleigh Ln
- 1458 Woodland Dr
- 435 Sandhurst Ln Unit 3
- 2359 Nantucket Ln Unit 9
- 2366 Nantucket Ln
- 2352 Cove Ct Unit 125B
- 1091 Delta Dr Unit 305E
- 962 Ascot Dr
- 590 Fenwick Ln
- 1419 S Pembroke Dr
- 387 S Pointe Ave
- 830 Baltusrol Dr
- 1705 College Green Dr Unit 2
- 8N594 S Mclean Blvd
- 1996 College Green Dr
- 761 Verde Vista Ct Unit 611F
- 2038 College Green Dr
- 126 Kingsport Dr
- 269 Kingsport Dr