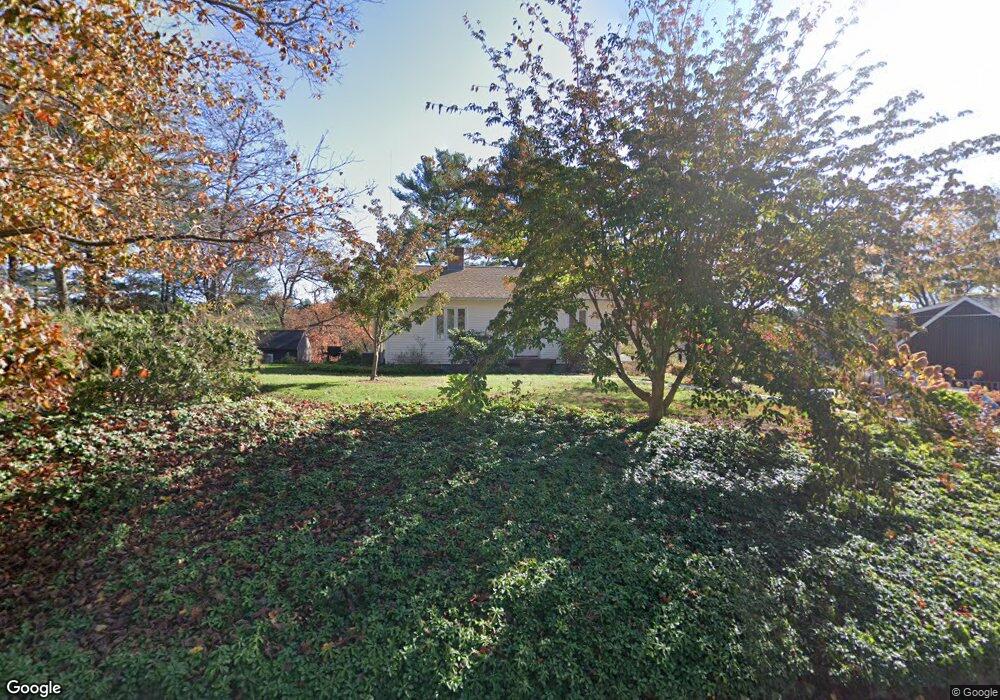
5 Shore Ave Maynard, MA 01754
Estimated Value: $498,000 - $712,000
2
Beds
1
Bath
1,044
Sq Ft
$557/Sq Ft
Est. Value
About This Home
This home is located at 5 Shore Ave, Maynard, MA 01754 and is currently estimated at $581,832, approximately $557 per square foot. 5 Shore Ave is a home located in Middlesex County with nearby schools including Center School, Hale Middle School, and Nashoba Regional High School.
Ownership History
Date
Name
Owned For
Owner Type
Purchase Details
Closed on
Aug 7, 2023
Sold by
Gay Ft and Drury
Bought by
Drury Ft and Drury
Current Estimated Value
Purchase Details
Closed on
Mar 8, 2023
Sold by
Drury Herbert R and Drury Elisabeth C
Bought by
Drury Ft and Drury
Purchase Details
Closed on
May 4, 2022
Sold by
Drury Elisabeth C
Bought by
Drury Ft and Drury
Create a Home Valuation Report for This Property
The Home Valuation Report is an in-depth analysis detailing your home's value as well as a comparison with similar homes in the area
Home Values in the Area
Average Home Value in this Area
Purchase History
| Date | Buyer | Sale Price | Title Company |
|---|---|---|---|
| Drury Ft | -- | None Available | |
| Drury Ft | -- | None Available | |
| Drury Ft | -- | None Available | |
| Drury Ft | -- | None Available | |
| Drury Herbert R | -- | None Available | |
| Drury Herbert R | -- | None Available | |
| Drury Ft | -- | None Available | |
| Drury Ft | -- | None Available |
Source: Public Records
Tax History
| Year | Tax Paid | Tax Assessment Tax Assessment Total Assessment is a certain percentage of the fair market value that is determined by local assessors to be the total taxable value of land and additions on the property. | Land | Improvement |
|---|---|---|---|---|
| 2025 | $8,683 | $487,000 | $299,600 | $187,400 |
| 2024 | $8,275 | $462,800 | $288,600 | $174,200 |
| 2023 | $8,134 | $428,800 | $274,600 | $154,200 |
| 2022 | $7,734 | $376,900 | $231,400 | $145,500 |
| 2021 | $7,472 | $370,800 | $231,400 | $139,400 |
| 2020 | $7,207 | $349,200 | $209,800 | $139,400 |
| 2019 | $6,950 | $330,300 | $200,600 | $129,700 |
| 2018 | $34,498 | $299,100 | $182,800 | $116,300 |
| 2017 | $6,614 | $300,500 | $182,800 | $117,700 |
| 2016 | $6,386 | $300,500 | $182,800 | $117,700 |
| 2015 | $6,160 | $276,100 | $174,700 | $101,400 |
| 2014 | $5,742 | $257,600 | $169,300 | $88,300 |
Source: Public Records
Map
Nearby Homes
- 41 Taylor Rd
- 10 Mill St Unit Q
- 10 Mill St Unit B
- 153 Summer St
- 34 Meeting House Ln Unit 208
- 13 Arthur St Unit 15
- 17 Prospect St
- 28 Waltham St Unit A
- 40 Saw Mill Rd
- 5 Hayes St Unit 5
- 12 Brown St
- 31-33 Roosevelt St
- 22 Douglas Ave Unit 2
- 22 Douglas Ave Unit 1
- 36 Brown St
- 15 Crescent St
- 66 Powder Mill Rd
- 68 Powder Mill Rd
- 70 Powder Mill Rd
- 2 & 6 Powder Mill Rd
- 5 Shore Ave
- 139 White Pond Rd
- 8 Shore Ave
- 2 Shore Ave
- 131 White Pond Rd
- 131 White Pond Rd Unit a
- 7 Shore Ave
- 4 Heights Terrace
- 4 Shore Ave
- 122 White Pond Rd
- 20 Riverview Ave
- 9 Shore Ave
- 120 White Pond Rd
- 6 Shore Ave
- 20 Riverview Ave
- 17 Riverview Ave
- 4 Riverside Park
- 12 Riverside Park
- 116 White Pond Rd
- 11 Shore Ave
Your Personal Tour Guide
Ask me questions while you tour the home.