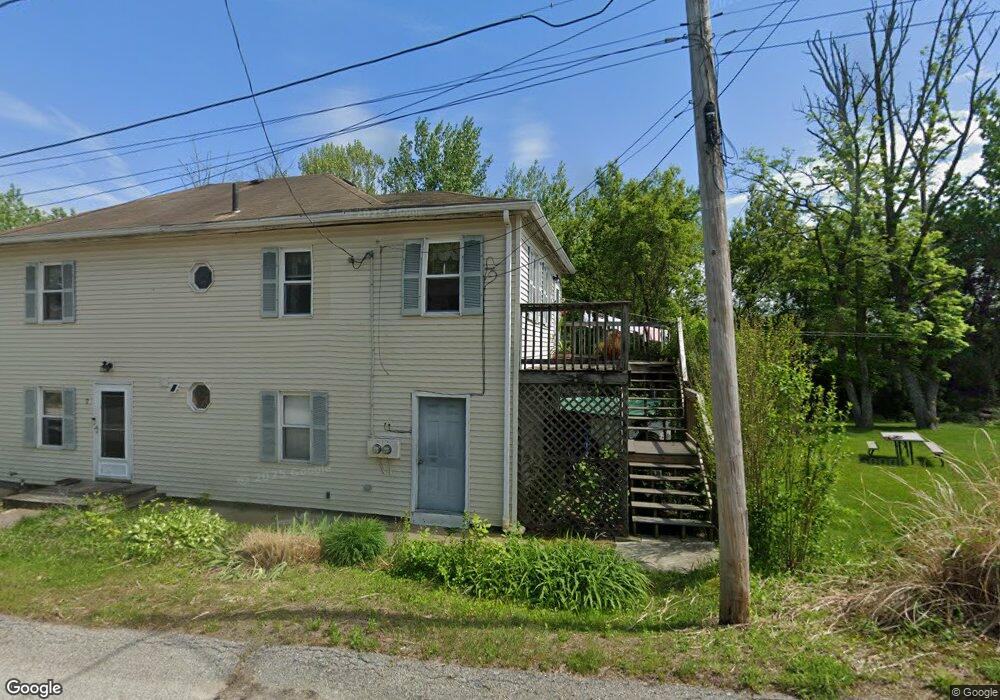
5 Simon St West Warwick, RI 02893
Lippitt-Harris NeighborhoodEstimated Value: $449,397 - $484,000
5
Beds
2
Baths
2,184
Sq Ft
$215/Sq Ft
Est. Value
About This Home
This home is located at 5 Simon St, West Warwick, RI 02893 and is currently estimated at $470,349, approximately $215 per square foot. 5 Simon St is a home located in Kent County with nearby schools including West Warwick High School, St Joseph School, and Islamic School of Rhode Island.
Ownership History
Date
Name
Owned For
Owner Type
Purchase Details
Closed on
Jul 9, 2004
Sold by
Courtney Design & Const
Bought by
Tri Star Constr
Current Estimated Value
Home Financials for this Owner
Home Financials are based on the most recent Mortgage that was taken out on this home.
Original Mortgage
$209,000
Outstanding Balance
$105,096
Interest Rate
6.32%
Mortgage Type
Purchase Money Mortgage
Estimated Equity
$365,253
Purchase Details
Closed on
May 11, 2004
Sold by
Sousa Alan D and Sousa Paula P
Bought by
Courtney Design & Cons
Home Financials for this Owner
Home Financials are based on the most recent Mortgage that was taken out on this home.
Original Mortgage
$209,000
Outstanding Balance
$105,096
Interest Rate
6.32%
Mortgage Type
Purchase Money Mortgage
Estimated Equity
$365,253
Create a Home Valuation Report for This Property
The Home Valuation Report is an in-depth analysis detailing your home's value as well as a comparison with similar homes in the area
Home Values in the Area
Average Home Value in this Area
Purchase History
| Date | Buyer | Sale Price | Title Company |
|---|---|---|---|
| Tri Star Constr | $120,000 | -- | |
| Courtney Design & Cons | $65,000 | -- |
Source: Public Records
Mortgage History
| Date | Status | Borrower | Loan Amount |
|---|---|---|---|
| Open | Courtney Design & Cons | $84,506 | |
| Open | Courtney Design & Cons | $209,000 |
Source: Public Records
Tax History Compared to Growth
Tax History
| Year | Tax Paid | Tax Assessment Tax Assessment Total Assessment is a certain percentage of the fair market value that is determined by local assessors to be the total taxable value of land and additions on the property. | Land | Improvement |
|---|---|---|---|---|
| 2025 | $5,477 | $383,300 | $74,800 | $308,500 |
| 2024 | $5,443 | $291,200 | $59,800 | $231,400 |
| 2023 | $5,335 | $291,200 | $59,800 | $231,400 |
| 2022 | $5,751 | $291,200 | $59,800 | $231,400 |
| 2021 | $6,286 | $210,300 | $59,800 | $150,500 |
| 2020 | $4,837 | $210,300 | $59,800 | $150,500 |
| 2019 | $6,166 | $210,300 | $59,800 | $150,500 |
| 2018 | $6,813 | $173,800 | $59,800 | $114,000 |
| 2017 | $6,596 | $173,800 | $59,800 | $114,000 |
| 2016 | $6,478 | $173,800 | $59,800 | $114,000 |
| 2015 | $6,254 | $167,800 | $59,800 | $108,000 |
| 2014 | $6,116 | $167,800 | $59,800 | $108,000 |
Source: Public Records
Map
Nearby Homes