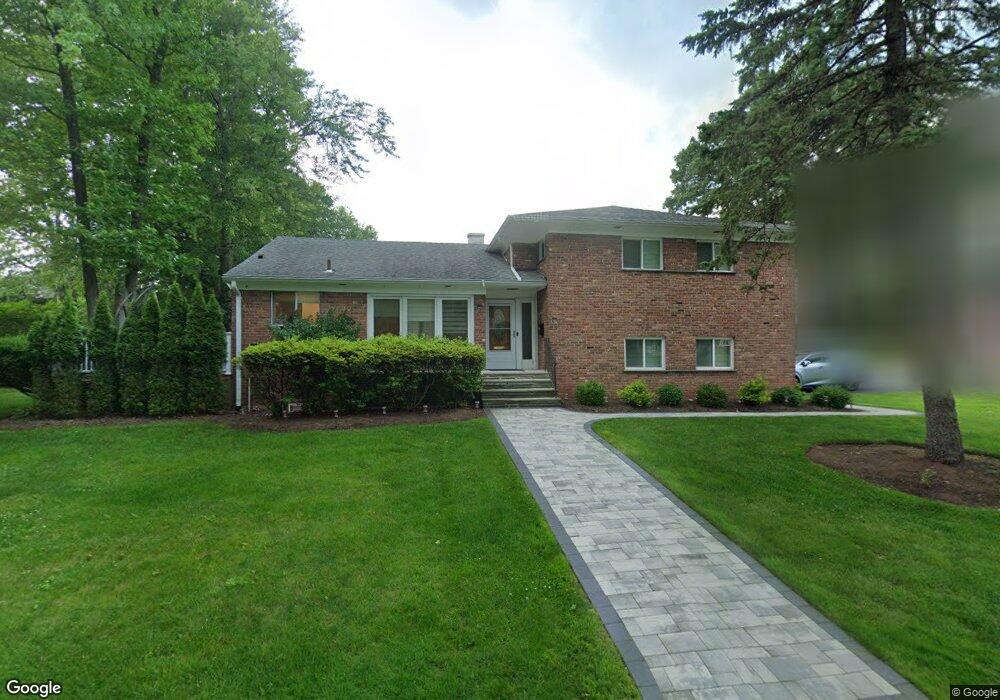
5 Spruce St Cresskill, NJ 07626
Estimated Value: $885,000 - $984,000
3
Beds
3
Baths
2,107
Sq Ft
$439/Sq Ft
Est. Value
About This Home
This home is located at 5 Spruce St, Cresskill, NJ 07626 and is currently estimated at $924,457, approximately $438 per square foot. 5 Spruce St is a home located in Bergen County with nearby schools including Cresskill High School, Lubavitch On The Palisades, and Academy of Our Lady of Mount Carmel.
Ownership History
Date
Name
Owned For
Owner Type
Purchase Details
Closed on
Jun 22, 2020
Sold by
Valentino Felix and Valentino Marianna
Bought by
Cheon Hyun Jun and Chung Hee Uk
Current Estimated Value
Home Financials for this Owner
Home Financials are based on the most recent Mortgage that was taken out on this home.
Original Mortgage
$408,000
Interest Rate
2.8%
Mortgage Type
New Conventional
Create a Home Valuation Report for This Property
The Home Valuation Report is an in-depth analysis detailing your home's value as well as a comparison with similar homes in the area
Home Values in the Area
Average Home Value in this Area
Purchase History
| Date | Buyer | Sale Price | Title Company |
|---|---|---|---|
| Cheon Hyun Jun | $510,000 | Hudson One Title Agency | |
| Cheon Hyun Jun | $510,000 | Hudson One Title |
Source: Public Records
Mortgage History
| Date | Status | Borrower | Loan Amount |
|---|---|---|---|
| Previous Owner | Cheon Hyun Jun | $408,000 |
Source: Public Records
Tax History
| Year | Tax Paid | Tax Assessment Tax Assessment Total Assessment is a certain percentage of the fair market value that is determined by local assessors to be the total taxable value of land and additions on the property. | Land | Improvement |
|---|---|---|---|---|
| 2025 | $13,223 | $619,000 | $327,600 | $291,400 |
| 2024 | $12,749 | $574,900 | $294,900 | $280,000 |
| 2023 | $12,502 | $549,300 | $277,400 | $271,900 |
| 2022 | $12,502 | $519,400 | $257,100 | $262,300 |
| 2021 | $12,342 | $505,400 | $249,600 | $255,800 |
| 2020 | $11,713 | $481,600 | $241,100 | $240,500 |
| 2019 | $11,431 | $474,900 | $237,600 | $237,300 |
| 2018 | $7,929 | $470,300 | $234,600 | $235,700 |
| 2017 | $11,914 | $437,700 | $194,400 | $243,300 |
| 2016 | $11,560 | $437,700 | $194,400 | $243,300 |
| 2015 | $11,201 | $437,700 | $194,400 | $243,300 |
| 2014 | $10,864 | $437,700 | $194,400 | $243,300 |
Source: Public Records
Map
Nearby Homes
- 136 Stonegate Trail Unit 37
- 119 Stonegate Trail
- 23 Cherry Ct
- 17 Jefferson Ave
- 170 Hickory Ave
- 51 Momar Dr
- 118 Sunset Ln
- 136 Elm St
- 292 Magnolia Ave
- 17 Wight Place
- 15 Dunn Place
- 206 10th St
- 40 5th St
- 168 4th St
- 181 Phelps Ave
- 196 Merritt Ave
- 20 Dojean Ct
- 121 Lylewood Dr
- 44 Bogert Place
- 368 Knickerbocker Rd
Your Personal Tour Guide
Ask me questions while you tour the home.