Estimated Value: $430,029 - $553,000
3
Beds
2
Baths
2,349
Sq Ft
$211/Sq Ft
Est. Value
About This Home
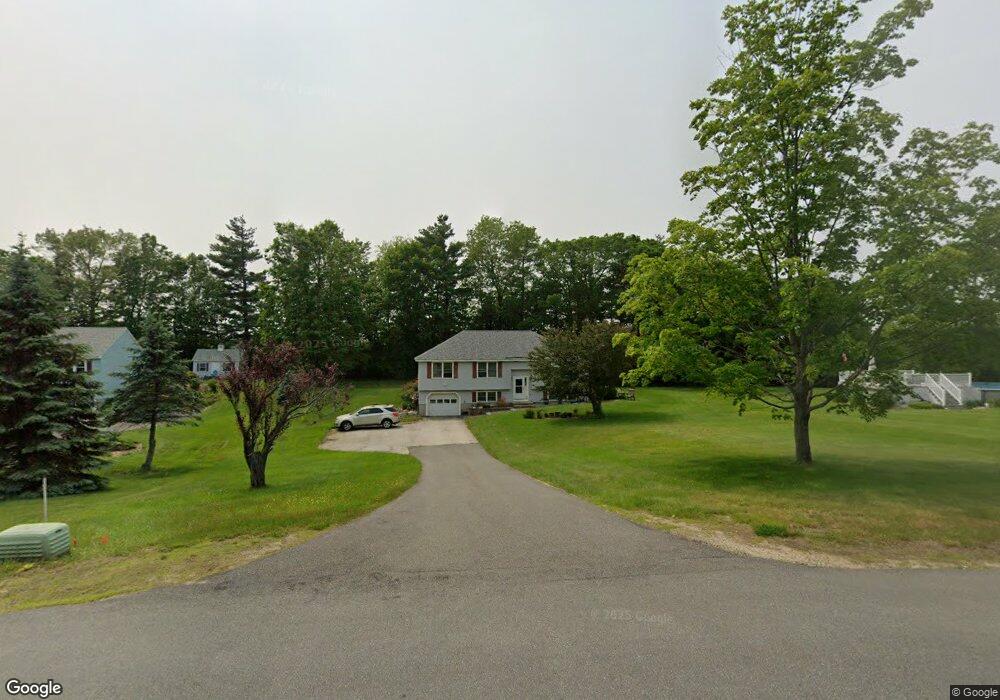
This home is located at 5 Squamscott Ave, Derry, NH 03038 and is currently estimated at $495,757, approximately $211 per square foot. 5 Squamscott Ave is a home located in Rockingham County with nearby schools including Derry Village School, West Running Brook Middle School, and Pinkerton Academy.
Ownership History
Date
Name
Owned For
Owner Type
Purchase Details
Closed on
Dec 18, 2013
Sold by
Brogan Thomas N and Brogan Tracey M
Bought by
Thomas N&T Brogan Ret
Current Estimated Value
Purchase Details
Closed on
Sep 1, 2009
Sold by
Dibari Jerome J and Dibari Marie T
Bought by
Brogan Thomas N and Brogan Tracey M
Home Financials for this Owner
Home Financials are based on the most recent Mortgage that was taken out on this home.
Original Mortgage
$200,000
Interest Rate
5.17%
Purchase Details
Closed on
Mar 18, 1997
Sold by
Jrv Homes Inc
Bought by
Dibari Jerome J and Dibari Marie T
Home Financials for this Owner
Home Financials are based on the most recent Mortgage that was taken out on this home.
Original Mortgage
$90,000
Interest Rate
7.79%
Create a Home Valuation Report for This Property
The Home Valuation Report is an in-depth analysis detailing your home's value as well as a comparison with similar homes in the area
Home Values in the Area
Average Home Value in this Area
Purchase History
| Date | Buyer | Sale Price | Title Company |
|---|---|---|---|
| Thomas N&T Brogan Ret | -- | -- | |
| Brogan Thomas N | $250,000 | -- | |
| Dibari Jerome J | $120,000 | -- |
Source: Public Records
Mortgage History
| Date | Status | Borrower | Loan Amount |
|---|---|---|---|
| Previous Owner | Dibari Jerome J | $194,000 | |
| Previous Owner | Dibari Jerome J | $200,000 | |
| Previous Owner | Dibari Jerome J | $90,000 |
Source: Public Records
Tax History
| Year | Tax Paid | Tax Assessment Tax Assessment Total Assessment is a certain percentage of the fair market value that is determined by local assessors to be the total taxable value of land and additions on the property. | Land | Improvement |
|---|---|---|---|---|
| 2025 | $8,477 | $446,400 | $0 | $446,400 |
| 2024 | $8,343 | $446,400 | $0 | $446,400 |
| 2023 | $7,838 | $379,000 | $0 | $379,000 |
| 2022 | $7,224 | $379,400 | $0 | $379,400 |
| 2021 | $7,364 | $297,400 | $0 | $297,400 |
| 2020 | $7,239 | $297,400 | $0 | $297,400 |
| 2019 | $6,951 | $266,100 | $86,000 | $180,100 |
| 2018 | $6,927 | $266,100 | $86,000 | $180,100 |
| 2017 | $7,495 | $259,700 | $86,000 | $173,700 |
| 2016 | $6,770 | $250,200 | $86,000 | $164,200 |
| 2015 | $6,574 | $224,900 | $86,000 | $138,900 |
| 2014 | $6,617 | $224,900 | $86,000 | $138,900 |
| 2013 | $6,569 | $208,600 | $86,000 | $122,600 |
Source: Public Records
Map
Nearby Homes
- 4 Westview Dr
- 13 Kilrea Rd Unit L
- 242 Rockingham Rd
- 6 Homestead Dr
- 52 Windham Depot Rd
- 5 Stone Fence Dr
- 38 Gordon Mountain Rd
- 5 Craven Terrace
- 7 Lilac Ridge Rd
- 24 Rockingham Rd
- 21 Berry Rd
- 16 Towne Dr
- 53 Trails Edge Rd
- 64 Trails Edge Rd
- 55 Trails Edge Rd
- 2 Brown Rd
- 45 Trails Edge Rd
- 20 Hancock Rd
- 139 Rockingham Rd Unit 21
- 51 Bedard Ave
- 7 Squamscott Ave
- 3 Squamscott Ave
- 6 Squamscott Ave
- 2 Westview Dr
- 9 Squamscott Ave
- 1 Squamscott Ave
- 4 Squamscott Ave
- 8 Squamscott Ave
- 10 Squamscott Ave
- 42 Kilrea Rd
- 11 Squamscott Ave
- 38 Kilrea Rd
- 1 Westview Dr
- 3 Westview Dr
- 12 Squamscott Ave
- 2 Squamscott Ave
- 13 Squamscott Ave
- 7 Pemigewasset Cir
- 14 Squamscott Ave
- 13 Pemigewasset Cir
Your Personal Tour Guide
Ask me questions while you tour the home.