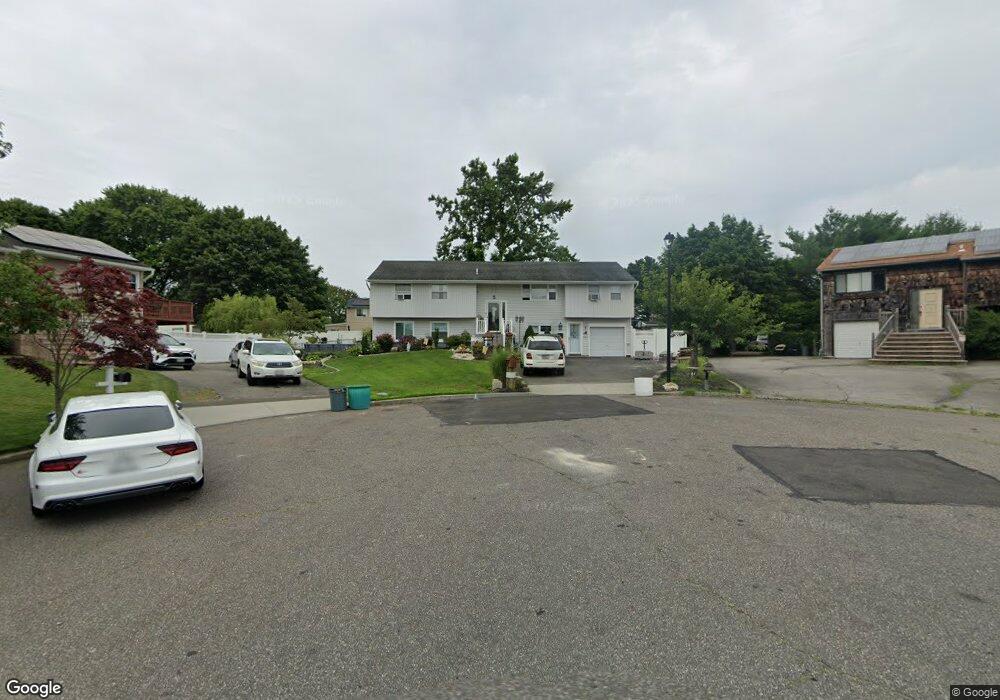
5 Star Ct East Patchogue, NY 11772
Estimated Value: $659,000 - $721,000
3
Beds
1
Bath
2,240
Sq Ft
$305/Sq Ft
Est. Value
About This Home
This home is located at 5 Star Ct, East Patchogue, NY 11772 and is currently estimated at $682,330, approximately $304 per square foot. 5 Star Ct is a home located in Suffolk County with nearby schools including Frank P Long Intermediate School, Bellport Middle School, and Bellport Senior High School.
Ownership History
Date
Name
Owned For
Owner Type
Purchase Details
Closed on
Aug 2, 2006
Current Estimated Value
Purchase Details
Closed on
Apr 12, 2004
Sold by
Lucero Cesar A and Ulloa Dora
Bought by
Lucero Cesar A
Purchase Details
Closed on
Oct 8, 2001
Sold by
Messier Richard
Bought by
Lucero Cesar A and Ulloa Dora
Home Financials for this Owner
Home Financials are based on the most recent Mortgage that was taken out on this home.
Original Mortgage
$196,000
Interest Rate
6.66%
Mortgage Type
Purchase Money Mortgage
Create a Home Valuation Report for This Property
The Home Valuation Report is an in-depth analysis detailing your home's value as well as a comparison with similar homes in the area
Home Values in the Area
Average Home Value in this Area
Purchase History
| Date | Buyer | Sale Price | Title Company |
|---|---|---|---|
| -- | -- | -- | |
| Lucero Cesar A | -- | -- | |
| Lucero Cesar A | $245,000 | Fidelity National Title Ins |
Source: Public Records
Mortgage History
| Date | Status | Borrower | Loan Amount |
|---|---|---|---|
| Previous Owner | Lucero Cesar A | $196,000 |
Source: Public Records
Tax History
| Year | Tax Paid | Tax Assessment Tax Assessment Total Assessment is a certain percentage of the fair market value that is determined by local assessors to be the total taxable value of land and additions on the property. | Land | Improvement |
|---|---|---|---|---|
| 2024 | $11,691 | $2,950 | $250 | $2,700 |
| 2023 | $11,691 | $2,950 | $250 | $2,700 |
| 2022 | $10,360 | $2,950 | $250 | $2,700 |
| 2021 | $10,360 | $2,950 | $250 | $2,700 |
| 2020 | $10,780 | $2,950 | $250 | $2,700 |
| 2019 | $10,780 | $0 | $0 | $0 |
| 2018 | $10,085 | $2,950 | $250 | $2,700 |
| 2017 | $10,085 | $2,950 | $250 | $2,700 |
| 2016 | $10,045 | $2,950 | $250 | $2,700 |
| 2015 | -- | $2,950 | $250 | $2,700 |
| 2014 | -- | $2,950 | $250 | $2,700 |
Source: Public Records
Map
Nearby Homes
Your Personal Tour Guide
Ask me questions while you tour the home.