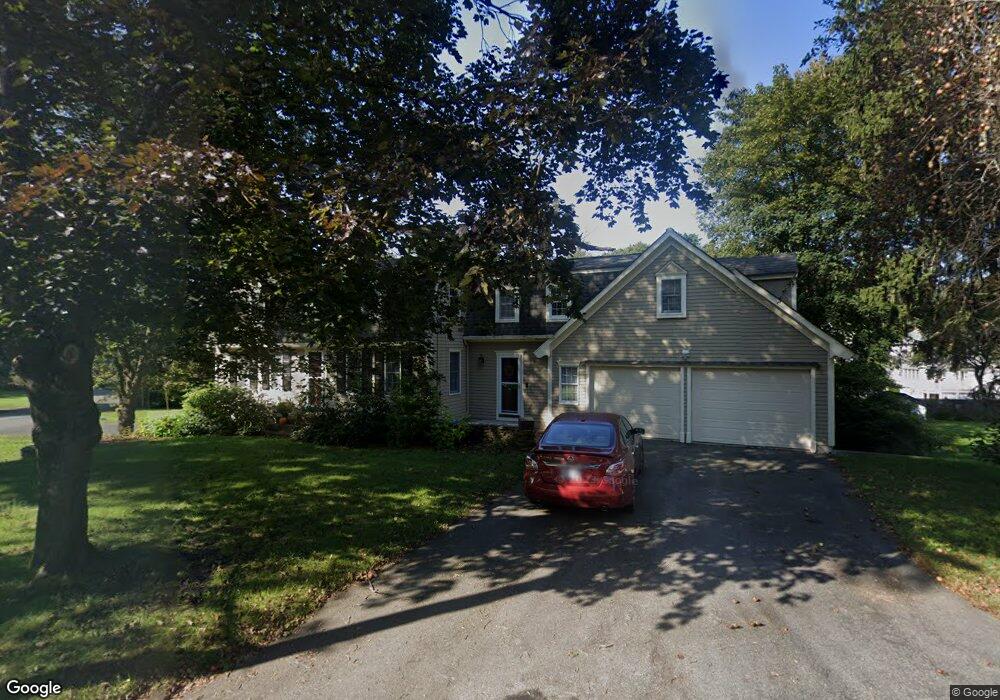
5 Stevens Cir Andover, MA 01810
East Andover NeighborhoodEstimated Value: $1,079,000 - $1,246,000
4
Beds
3
Baths
2,282
Sq Ft
$499/Sq Ft
Est. Value
About This Home
This home is located at 5 Stevens Cir, Andover, MA 01810 and is currently estimated at $1,138,056, approximately $498 per square foot. 5 Stevens Cir is a home located in Essex County with nearby schools including Bancroft Elementary School, Doherty Middle School, and Andover High School.
Ownership History
Date
Name
Owned For
Owner Type
Purchase Details
Closed on
Jul 17, 2006
Sold by
Valdini Anthony and Valdini Maureen P
Bought by
Morgan Mark
Current Estimated Value
Home Financials for this Owner
Home Financials are based on the most recent Mortgage that was taken out on this home.
Original Mortgage
$448,000
Outstanding Balance
$258,318
Interest Rate
6.71%
Mortgage Type
Purchase Money Mortgage
Estimated Equity
$879,738
Purchase Details
Closed on
Sep 12, 2002
Sold by
Lavoie John and Lavoie Denise C
Bought by
Valdini Anthony and Valdini Maureen P
Create a Home Valuation Report for This Property
The Home Valuation Report is an in-depth analysis detailing your home's value as well as a comparison with similar homes in the area
Home Values in the Area
Average Home Value in this Area
Purchase History
We collect this data history from publicly available records. To have your information removed, we recommend requesting removal directly through your county’s website.
| Date | Buyer | Sale Price | Title Company |
|---|---|---|---|
| Morgan Mark | $560,000 | -- | |
| Morgan Mark E | $560,000 | -- | |
| Morgan Mark E | $560,000 | -- | |
| Valdini Anthony | $509,000 | -- | |
| Valdini Anthony F | $509,000 | -- |
Source: Public Records
Mortgage History
We collect this data history from publicly available records. To have your information removed, we recommend requesting removal directly through your county’s website.
| Date | Status | Borrower | Loan Amount |
|---|---|---|---|
| Open | Morgan Mark E | $448,000 | |
| Closed | Valdini Anthony F | $448,000 |
Source: Public Records
Tax History
| Year | Tax Paid | Tax Assessment Tax Assessment Total Assessment is a certain percentage of the fair market value that is determined by local assessors to be the total taxable value of land and additions on the property. | Land | Improvement |
|---|---|---|---|---|
| 2025 | $12,221 | $978,500 | $549,600 | $428,900 |
| 2024 | $11,932 | $926,400 | $546,400 | $380,000 |
| 2023 | $11,402 | $834,700 | $492,100 | $342,600 |
| 2022 | $10,652 | $729,600 | $428,000 | $301,600 |
| 2021 | $10,188 | $666,300 | $389,000 | $277,300 |
| 2020 | $9,769 | $650,800 | $379,400 | $271,400 |
| 2019 | $9,681 | $634,000 | $368,400 | $265,600 |
| 2018 | $9,365 | $598,800 | $354,200 | $244,600 |
| 2017 | $8,950 | $589,600 | $347,100 | $242,500 |
| 2016 | $8,707 | $587,500 | $347,100 | $240,400 |
| 2015 | $8,391 | $560,500 | $333,700 | $226,800 |
Source: Public Records
Map
Nearby Homes
- 4 Applecrest Rd
- 324 Hillside Rd
- 12 Burton Farm Dr
- 33 Chestnut St Unit 2
- 9 Elm Ct
- 154 Main St
- 8 Chestnut St
- 31 School St Unit 1
- 16R High St
- 49 Salem St
- 2 Powder Mill Square Unit 2B
- 20 Washington Park Dr Unit 12
- 7 Rock o Dundee Rd
- 2 Brechin Terrace
- 11 Cuba St
- 3 Buchan Rd
- 25 Ridge Way
- 40 Lincoln Cir E
- 15-17 Stirling St
- 275 S Main St
Your Personal Tour Guide
Ask me questions while you tour the home.