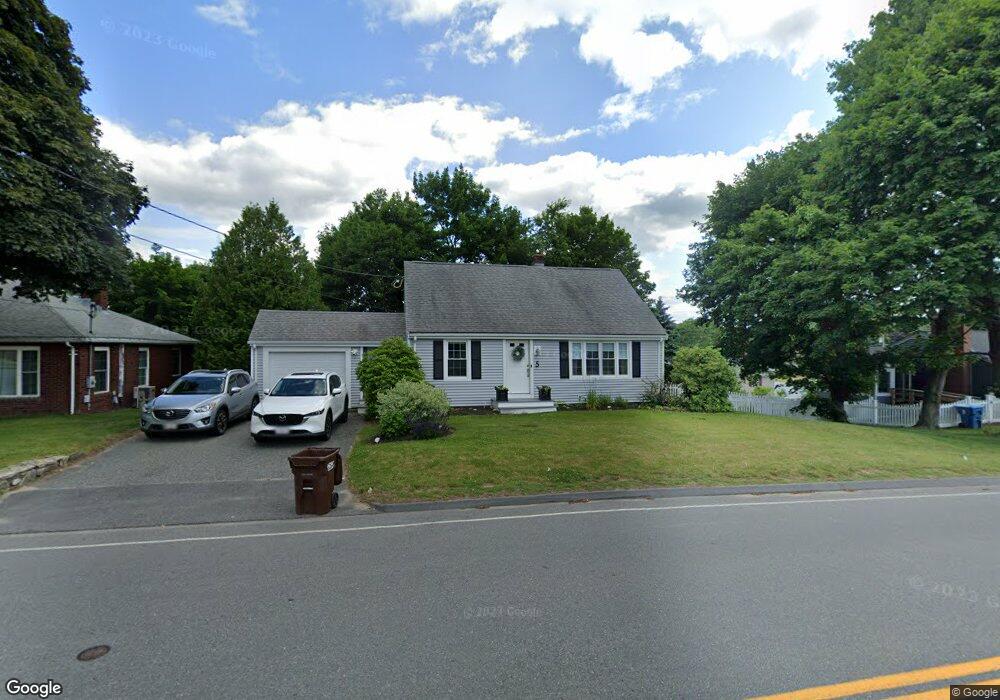
5 Swanson Rd Auburn, MA 01501
Stoneville NeighborhoodEstimated Value: $436,000 - $493,000
3
Beds
2
Baths
1,165
Sq Ft
$392/Sq Ft
Est. Value
About This Home
This home is located at 5 Swanson Rd, Auburn, MA 01501 and is currently estimated at $457,125, approximately $392 per square foot. 5 Swanson Rd is a home located in Worcester County with nearby schools including Auburn Senior High School and Shrewsbury Montessori School - Auburn Campus.
Ownership History
Date
Name
Owned For
Owner Type
Purchase Details
Closed on
Nov 18, 2021
Sold by
Bond Ellen H and Briggs Ellen H
Bought by
Bond Ellen H and Bond Gerald
Current Estimated Value
Purchase Details
Closed on
Jun 16, 1993
Sold by
Rhodes Robert G and Rhodes Theresa A
Bought by
Briggs Andrew W
Home Financials for this Owner
Home Financials are based on the most recent Mortgage that was taken out on this home.
Original Mortgage
$111,600
Interest Rate
7.38%
Mortgage Type
Purchase Money Mortgage
Purchase Details
Closed on
Sep 14, 1987
Sold by
Orne Janice E L
Bought by
Rhodes Robert G
Home Financials for this Owner
Home Financials are based on the most recent Mortgage that was taken out on this home.
Original Mortgage
$100,000
Interest Rate
10.27%
Mortgage Type
Purchase Money Mortgage
Create a Home Valuation Report for This Property
The Home Valuation Report is an in-depth analysis detailing your home's value as well as a comparison with similar homes in the area
Home Values in the Area
Average Home Value in this Area
Purchase History
| Date | Buyer | Sale Price | Title Company |
|---|---|---|---|
| Bond Ellen H | -- | None Available | |
| Briggs Andrew W | $124,000 | -- | |
| Rhodes Robert G | $115,000 | -- |
Source: Public Records
Mortgage History
| Date | Status | Borrower | Loan Amount |
|---|---|---|---|
| Previous Owner | Rhodes Robert G | $138,040 | |
| Previous Owner | Rhodes Robert G | $111,600 | |
| Previous Owner | Rhodes Robert G | $87,900 | |
| Previous Owner | Rhodes Robert G | $100,000 |
Source: Public Records
Tax History Compared to Growth
Tax History
| Year | Tax Paid | Tax Assessment Tax Assessment Total Assessment is a certain percentage of the fair market value that is determined by local assessors to be the total taxable value of land and additions on the property. | Land | Improvement |
|---|---|---|---|---|
| 2025 | $51 | $357,300 | $114,200 | $243,100 |
| 2024 | $5,081 | $340,300 | $108,500 | $231,800 |
| 2023 | $4,993 | $314,400 | $98,600 | $215,800 |
| 2022 | $4,642 | $276,000 | $98,600 | $177,400 |
| 2021 | $4,377 | $241,300 | $87,000 | $154,300 |
| 2020 | $4,225 | $235,000 | $87,000 | $148,000 |
| 2019 | $4,124 | $223,900 | $86,100 | $137,800 |
| 2018 | $3,896 | $211,300 | $80,500 | $130,800 |
| 2017 | $3,696 | $201,500 | $73,000 | $128,500 |
| 2016 | $3,522 | $194,700 | $76,800 | $117,900 |
| 2015 | $3,324 | $192,600 | $76,800 | $115,800 |
| 2014 | $3,261 | $188,600 | $73,100 | $115,500 |
Source: Public Records
Map
Nearby Homes
- 83 Bryn Mawr Ave
- 1 Ashcroft St
- 11 Inwood Rd
- 33 Walsh Ave
- 31-33 Walsh Ave
- 31 Walsh Ave
- 381 Oxford St N
- 52 Harrison Ave
- 19-20 Williams St
- 34 Rockland Rd
- 30 Briarcliff Dr
- 2 Victoria Dr Unit 1
- 177 Oxford St N
- 326 Pakachoag St
- 12 Lancaster St
- 1-9 Helens Way
- 25 Vinal St Unit 26
- 25 Vinal St Unit 29
- 25 Vinal St Unit 30
- 21 Linda Ave