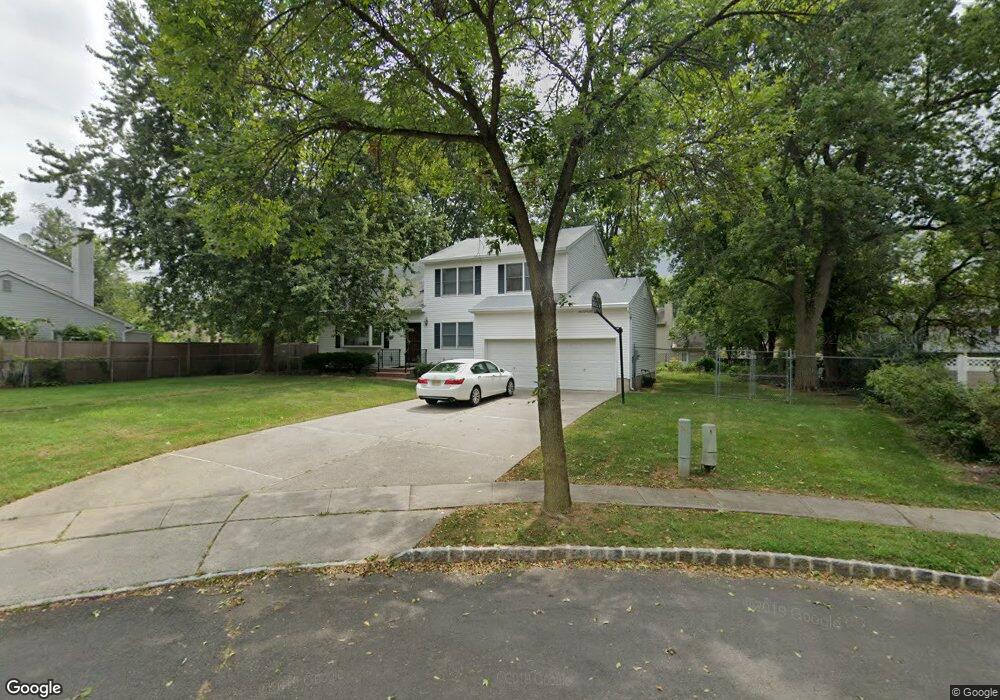
5 Sycamore Ln Piscataway, NJ 08854
Estimated Value: $788,935
--
Bed
--
Bath
2,254
Sq Ft
$350/Sq Ft
Est. Value
About This Home
This home is located at 5 Sycamore Ln, Piscataway, NJ 08854 and is currently estimated at $788,935, approximately $350 per square foot. 5 Sycamore Ln is a home located in Middlesex County with nearby schools including Randolphville Elementary School, Martin Luther King Intermediate School, and Quibbletown Middle School.
Ownership History
Date
Name
Owned For
Owner Type
Purchase Details
Closed on
Jun 14, 2018
Sold by
Jarmon Roy Lee and Jarmon Roy L
Bought by
Jarmon Roy L and Grant Audrey
Current Estimated Value
Home Financials for this Owner
Home Financials are based on the most recent Mortgage that was taken out on this home.
Original Mortgage
$362,400
Outstanding Balance
$333,241
Interest Rate
7.87%
Mortgage Type
Adjustable Rate Mortgage/ARM
Estimated Equity
$455,694
Purchase Details
Closed on
May 5, 1994
Sold by
Joseph Building
Bought by
Jarmon Roy and Jarmon Nathalyn
Home Financials for this Owner
Home Financials are based on the most recent Mortgage that was taken out on this home.
Original Mortgage
$172,000
Interest Rate
7.93%
Create a Home Valuation Report for This Property
The Home Valuation Report is an in-depth analysis detailing your home's value as well as a comparison with similar homes in the area
Home Values in the Area
Average Home Value in this Area
Purchase History
| Date | Buyer | Sale Price | Title Company |
|---|---|---|---|
| Jarmon Roy L | -- | None Available | |
| Jarmon Roy | $190,600 | -- |
Source: Public Records
Mortgage History
| Date | Status | Borrower | Loan Amount |
|---|---|---|---|
| Open | Jarmon Roy L | $362,400 | |
| Closed | Jarmon Roy | $172,000 |
Source: Public Records
Tax History Compared to Growth
Tax History
| Year | Tax Paid | Tax Assessment Tax Assessment Total Assessment is a certain percentage of the fair market value that is determined by local assessors to be the total taxable value of land and additions on the property. | Land | Improvement |
|---|---|---|---|---|
| 2025 | -- | $608,500 | $283,600 | $324,900 |
| 2024 | -- | $573,300 | $183,000 | $390,300 |
| 2023 | -- | $520,300 | $183,000 | $337,300 |
| 2022 | $0 | $462,300 | $183,000 | $279,300 |
| 2021 | $0 | $433,000 | $183,000 | $250,000 |
| 2020 | $0 | $453,500 | $183,000 | $270,500 |
| 2019 | $0 | $452,400 | $183,000 | $269,400 |
| 2018 | $0 | $436,600 | $183,000 | $253,600 |
| 2017 | $0 | $305,000 | $103,000 | $202,000 |
| 2016 | $0 | $305,000 | $103,000 | $202,000 |
| 2015 | -- | $305,000 | $103,000 | $202,000 |
| 2014 | -- | $305,000 | $103,000 | $202,000 |
Source: Public Records
Map
Nearby Homes