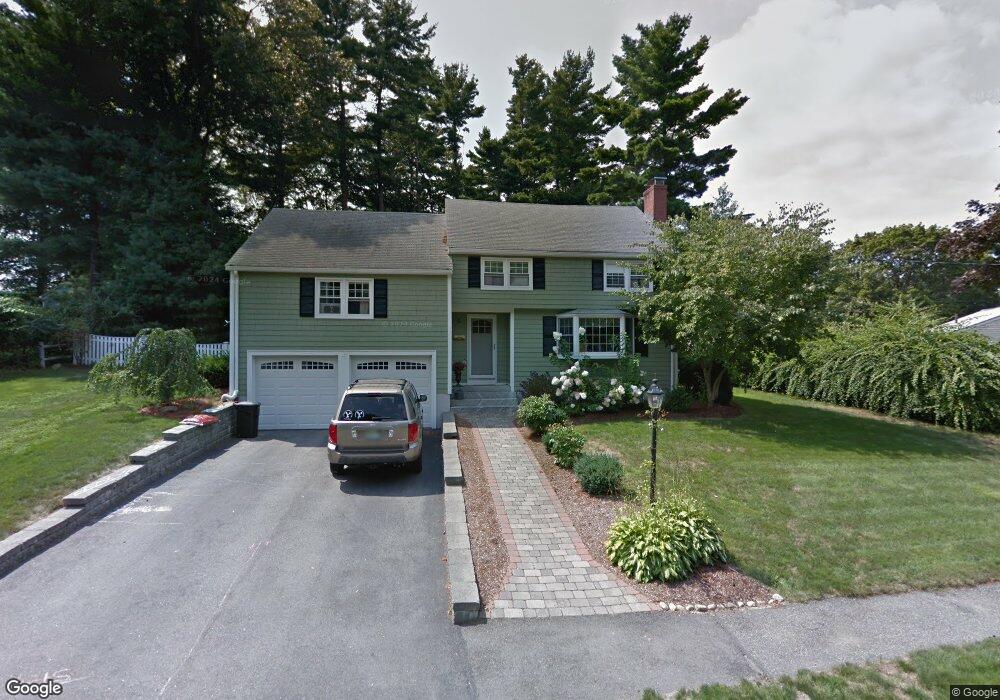
5 Temple Rd Lynnfield, MA 01940
Estimated Value: $936,028 - $1,040,000
4
Beds
2
Baths
1,858
Sq Ft
$524/Sq Ft
Est. Value
About This Home
This home is located at 5 Temple Rd, Lynnfield, MA 01940 and is currently estimated at $973,007, approximately $523 per square foot. 5 Temple Rd is a home located in Essex County with nearby schools including Lynnfield Middle School, Lynnfield High School, and Our Lady Of Assumption School.
Ownership History
Date
Name
Owned For
Owner Type
Purchase Details
Closed on
Oct 4, 2016
Sold by
John C Kelleher
Bought by
Daly Graham and Daly Lisa
Current Estimated Value
Home Financials for this Owner
Home Financials are based on the most recent Mortgage that was taken out on this home.
Original Mortgage
$67,755
Outstanding Balance
$54,249
Interest Rate
3.42%
Estimated Equity
$918,758
Purchase Details
Closed on
Dec 16, 2004
Sold by
Pagano Margaret E Est and Pagano Janice K
Bought by
Daly Graham and Daly Lisa
Home Financials for this Owner
Home Financials are based on the most recent Mortgage that was taken out on this home.
Original Mortgage
$467,900
Interest Rate
5.68%
Mortgage Type
Purchase Money Mortgage
Create a Home Valuation Report for This Property
The Home Valuation Report is an in-depth analysis detailing your home's value as well as a comparison with similar homes in the area
Home Values in the Area
Average Home Value in this Area
Purchase History
| Date | Buyer | Sale Price | Title Company |
|---|---|---|---|
| Daly Graham | -- | -- | |
| Daly Graham | $519,900 | -- |
Source: Public Records
Mortgage History
| Date | Status | Borrower | Loan Amount |
|---|---|---|---|
| Open | Daly Graham | $67,755 | |
| Closed | Daly Graham | -- | |
| Previous Owner | Daly Graham | $426,000 | |
| Previous Owner | Daly Graham | $24,000 | |
| Previous Owner | Daly Graham | $467,900 |
Source: Public Records
Tax History
| Year | Tax Paid | Tax Assessment Tax Assessment Total Assessment is a certain percentage of the fair market value that is determined by local assessors to be the total taxable value of land and additions on the property. | Land | Improvement |
|---|---|---|---|---|
| 2025 | $9,332 | $883,700 | $564,400 | $319,300 |
| 2024 | $8,930 | $849,700 | $542,700 | $307,000 |
| 2023 | $8,946 | $791,700 | $514,700 | $277,000 |
| 2022 | $8,609 | $718,000 | $472,700 | $245,300 |
| 2021 | $8,124 | $612,200 | $385,200 | $227,000 |
| 2020 | $7,962 | $572,000 | $345,000 | $227,000 |
| 2019 | $7,957 | $572,000 | $345,000 | $227,000 |
| 2018 | $7,871 | $572,000 | $345,000 | $227,000 |
| 2017 | $7,713 | $559,700 | $332,700 | $227,000 |
| 2016 | $7,198 | $496,400 | $285,500 | $210,900 |
| 2015 | $7,177 | $495,300 | $284,400 | $210,900 |
Source: Public Records
Map
Nearby Homes
- 715 Summer St
- 33 Rockwood Rd
- 11 Elizabeth Way
- 35 Lincoln Ave
- 410 Salem St Unit 1203
- 143 Winona St
- 741 Salem St
- 344 Broadway
- 11 Hutchins Cir
- 6 Ashley Ct
- 114 Lake St
- 903 Foxwood Cir Unit 903
- 20 Pine Hill Rd
- 395 Vernon St
- 159 Main St
- 67 Woodcrest Dr
- 103 Foxwood Cir
- 12 Heritage Ln
- 7 Pinewood Rd
- 9 Broadway Unit 210
Your Personal Tour Guide
Ask me questions while you tour the home.