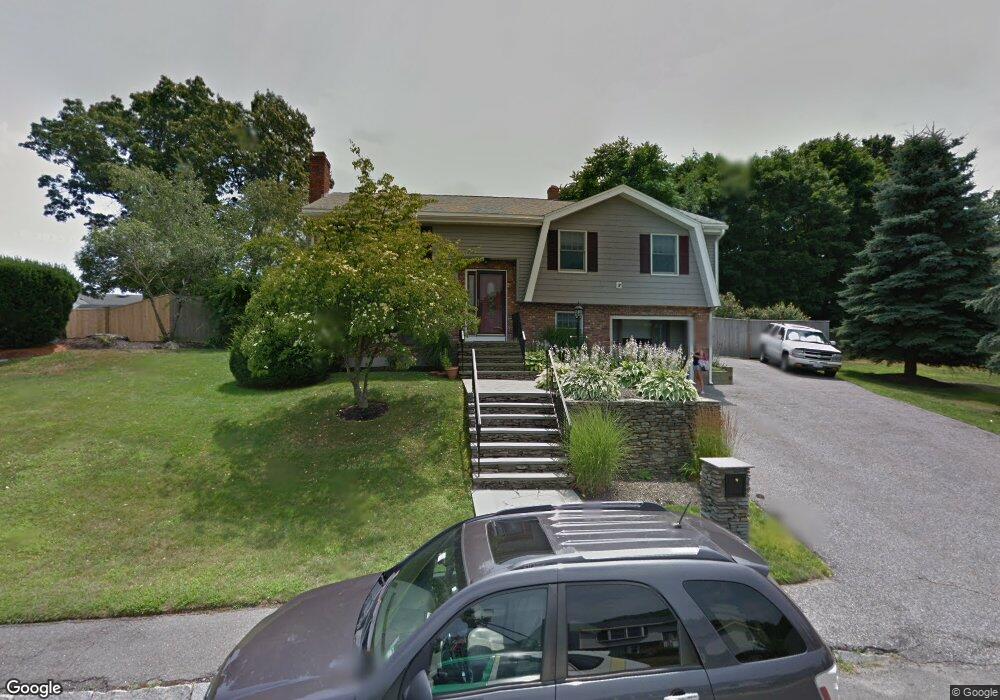
5 Thomas St Woburn, MA 01801
Mishawum NeighborhoodEstimated Value: $658,000 - $866,000
4
Beds
3
Baths
1,100
Sq Ft
$709/Sq Ft
Est. Value
About This Home
This home is located at 5 Thomas St, Woburn, MA 01801 and is currently estimated at $779,367, approximately $708 per square foot. 5 Thomas St is a home located in Middlesex County with nearby schools including Linscott-Rumford Elementary School, John F. Kennedy Middle School, and Woburn High School.
Ownership History
Date
Name
Owned For
Owner Type
Purchase Details
Closed on
Feb 28, 2020
Sold by
Nestor Elizabeth and Nestor Vincent P
Bought by
Nestor Elizabeth
Current Estimated Value
Home Financials for this Owner
Home Financials are based on the most recent Mortgage that was taken out on this home.
Original Mortgage
$375,000
Outstanding Balance
$330,683
Interest Rate
3.5%
Mortgage Type
New Conventional
Estimated Equity
$448,684
Purchase Details
Closed on
Jul 31, 1998
Sold by
Sheldon Robert B
Bought by
Nestor Vinvent P and Nestor Elizabeth
Purchase Details
Closed on
Nov 29, 1995
Sold by
Anderson Robert A and Anderson Beda M
Bought by
Sheldon Robert B
Purchase Details
Closed on
May 31, 1991
Sold by
Mccormick John J and Mccormick Cecile
Bought by
Anderson Wayne A and Anderson Beda M
Create a Home Valuation Report for This Property
The Home Valuation Report is an in-depth analysis detailing your home's value as well as a comparison with similar homes in the area
Home Values in the Area
Average Home Value in this Area
Purchase History
| Date | Buyer | Sale Price | Title Company |
|---|---|---|---|
| Nestor Elizabeth | -- | None Available | |
| Nestor Elizabeth | -- | None Available | |
| Nestor Elizabeth | -- | None Available | |
| Nestor Vinvent P | $196,000 | -- | |
| Nestor Vinvent P | $196,000 | -- | |
| Sheldon Robert B | $164,000 | -- | |
| Sheldon Robert B | $164,000 | -- | |
| Anderson Wayne A | $175,000 | -- | |
| Anderson Wayne A | $175,000 | -- |
Source: Public Records
Mortgage History
| Date | Status | Borrower | Loan Amount |
|---|---|---|---|
| Open | Nestor Elizabeth | $375,000 | |
| Closed | Nestor Elizabeth | $375,000 | |
| Previous Owner | Anderson Wayne A | $215,000 |
Source: Public Records
Tax History Compared to Growth
Tax History
| Year | Tax Paid | Tax Assessment Tax Assessment Total Assessment is a certain percentage of the fair market value that is determined by local assessors to be the total taxable value of land and additions on the property. | Land | Improvement |
|---|---|---|---|---|
| 2025 | $5,637 | $660,100 | $317,800 | $342,300 |
| 2024 | $5,199 | $645,000 | $302,700 | $342,300 |
| 2023 | $5,035 | $578,700 | $275,200 | $303,500 |
| 2022 | $4,853 | $519,600 | $239,300 | $280,300 |
| 2021 | $4,700 | $503,800 | $227,900 | $275,900 |
| 2020 | $4,532 | $486,300 | $227,900 | $258,400 |
| 2019 | $4,277 | $450,200 | $217,100 | $233,100 |
| 2018 | $4,078 | $412,300 | $199,200 | $213,100 |
| 2017 | $3,925 | $394,900 | $189,700 | $205,200 |
| 2016 | $3,795 | $377,600 | $177,300 | $200,300 |
| 2015 | $3,655 | $359,400 | $165,600 | $193,800 |
| 2014 | $3,402 | $325,900 | $169,100 | $156,800 |
Source: Public Records
Map
Nearby Homes
- 3 Highet Ave
- 6 Callahan Dr
- 20 Barbara Cir
- 104 Forest Park Rd
- 52 Middle St
- 0 Fryeburg Rd
- 38 Middle St
- 28 Van Norden Rd
- 4 Maywood Terrace
- 8 Clinton St
- 12 Mishawum Rd
- 3 Hart St
- 74 Beach St Unit 6-12
- 74 Beach St Unit 3
- 6 Tidd Ave
- 18 Hamilton Rd
- 6R & 6 Tidd Ave
- 166 Place Ln Unit 166
- 168 Place Ln
- 602 Main St Unit 1
- 7 Thomas St
- 3 Thomas St
- 8 Rumford Park Ave
- 10 Rumford Park Ave
- 12 Rumford Park Ave
- 6 Thomas St
- 14 Rumford Park Ave
- 8 Thomas St
- 16 Rumford Park Ave
- 6 Rumford Park Ave
- 4 Thomas St
- 1 Thomas St
- 11 Rumford Park Ave
- 9 Thomas St
- 13 Rumford Park Ave
- 10 Thomas St
- 9 Rumford Park Ave
- 3 Cronin Way
- 2 Thomas St
- 18 Rumford Park Ave