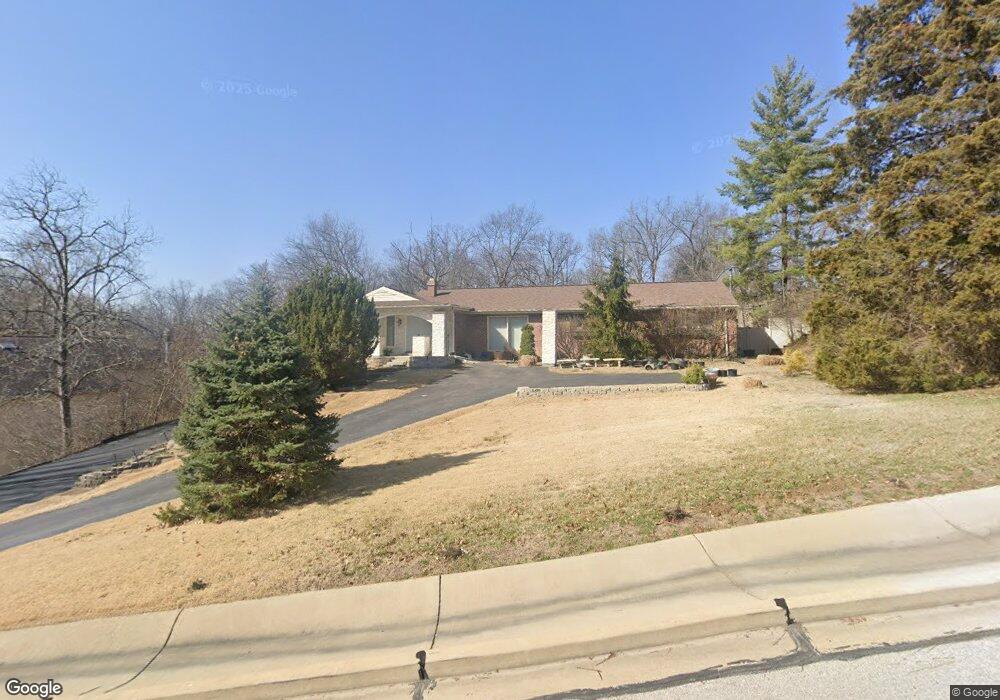
5 Topping Ln Unit 12 Saint Louis, MO 63131
Estimated Value: $713,000 - $816,000
4
Beds
3
Baths
3,146
Sq Ft
$239/Sq Ft
Est. Value
About This Home
This home is located at 5 Topping Ln Unit 12, Saint Louis, MO 63131 and is currently estimated at $751,342, approximately $238 per square foot. 5 Topping Ln Unit 12 is a home located in St. Louis County with nearby schools including Barretts Elementary School, Parkway South Middle School, and Parkway South High School.
Ownership History
Date
Name
Owned For
Owner Type
Purchase Details
Closed on
Nov 16, 2004
Sold by
Ameriquest Mortgage Co
Bought by
Paschke Lawrence F and Paschke Mary C
Current Estimated Value
Home Financials for this Owner
Home Financials are based on the most recent Mortgage that was taken out on this home.
Original Mortgage
$221,200
Interest Rate
5.68%
Mortgage Type
Purchase Money Mortgage
Purchase Details
Closed on
Dec 4, 2003
Sold by
Harford Mark R
Bought by
Ameriquest Mortgage Co
Purchase Details
Closed on
Oct 26, 2001
Sold by
Caimi Louis T and Baldwin Dianne
Bought by
Caimi Louis T
Purchase Details
Closed on
Aug 20, 2001
Sold by
Clark Arthur and Clark Angelika
Bought by
Clark Arthur F and Clark Angelika
Home Financials for this Owner
Home Financials are based on the most recent Mortgage that was taken out on this home.
Original Mortgage
$236,250
Interest Rate
7.07%
Purchase Details
Closed on
May 29, 1997
Sold by
Pasha Thomas W and Pasha Karen S
Bought by
Caimi Louis T and Caimi Dianne J
Home Financials for this Owner
Home Financials are based on the most recent Mortgage that was taken out on this home.
Original Mortgage
$192,800
Interest Rate
7.37%
Create a Home Valuation Report for This Property
The Home Valuation Report is an in-depth analysis detailing your home's value as well as a comparison with similar homes in the area
Home Values in the Area
Average Home Value in this Area
Purchase History
| Date | Buyer | Sale Price | Title Company |
|---|---|---|---|
| Paschke Lawrence F | $276,500 | -- | |
| Ameriquest Mortgage Co | $251,000 | -- | |
| Caimi Louis T | -- | -- | |
| Clark Arthur F | -- | -- | |
| Caimi Louis T | -- | -- |
Source: Public Records
Mortgage History
| Date | Status | Borrower | Loan Amount |
|---|---|---|---|
| Closed | Paschke Lawrence F | $221,200 | |
| Previous Owner | Clark Arthur F | $236,250 | |
| Previous Owner | Caimi Louis T | $192,800 | |
| Closed | Clark Arthur F | $430,000 | |
| Closed | Paschke Lawrence F | $27,650 |
Source: Public Records
Tax History Compared to Growth
Tax History
| Year | Tax Paid | Tax Assessment Tax Assessment Total Assessment is a certain percentage of the fair market value that is determined by local assessors to be the total taxable value of land and additions on the property. | Land | Improvement |
|---|---|---|---|---|
| 2025 | $5,785 | $128,080 | $64,890 | $63,190 |
| 2024 | $5,785 | $103,040 | $44,920 | $58,120 |
| 2023 | $5,701 | $103,040 | $44,920 | $58,120 |
| 2022 | $5,475 | $89,900 | $46,470 | $43,430 |
| 2021 | $5,429 | $89,900 | $46,470 | $43,430 |
| 2020 | $4,873 | $77,110 | $28,600 | $48,510 |
| 2019 | $4,805 | $77,110 | $28,600 | $48,510 |
| 2018 | $4,513 | $66,920 | $24,990 | $41,930 |
| 2017 | $4,452 | $66,920 | $24,990 | $41,930 |
| 2016 | $3,697 | $52,760 | $16,300 | $36,460 |
| 2015 | $3,895 | $52,760 | $16,300 | $36,460 |
| 2014 | $3,151 | $46,290 | $10,740 | $35,550 |
Source: Public Records
Map
Nearby Homes
- 12841 Thornhill Ct
- 1824 Topping Rd
- 2211 Viewroyal Dr
- 13112 Thornhill Dr
- 2300 E Royal Ct
- 2405 Fairoyal Dr
- 12213 Brook Springs Ct
- 1515 Topping Rd
- 2527 Barrett Place Dr
- 2522 Barrett Place Dr
- 13354 Thornhill Dr
- 918 N Ballas Rd
- 2145 Trailcrest Dr
- 12224 TBB Roger Ln
- 12439 Springdale Ln Unit TBB
- 2037 Trailcrest Ln Unit 7
- 1603 Forestview Ridge Ln
- 13124 Huntercreek Ridge Rd
- 698 Trailcrest Ct Unit 5
- 1826 S Mason Rd
- 5 Topping Ln
- 7 Topping Ln
- 1 Topping Lnz
- 1 Topping Ln
- 6 Topping Ln
- 3 Topping Ln
- 9 Topping Ln
- 8 Topping Ln
- 4 Topping Ln
- 10 Topping Ln
- 13201 Bonroyal Dr
- 11 Topping Ln
- 2100 Cedaroyal Dr
- 13209 Bonroyal Dr
- 12TBB Topping Ln
- 12 Topping Lane Uc
- 12 Topping Ln
- 13208 Manchester Rd
- 5 Jonclif Ln
- 2108 Cedaroyal Dr