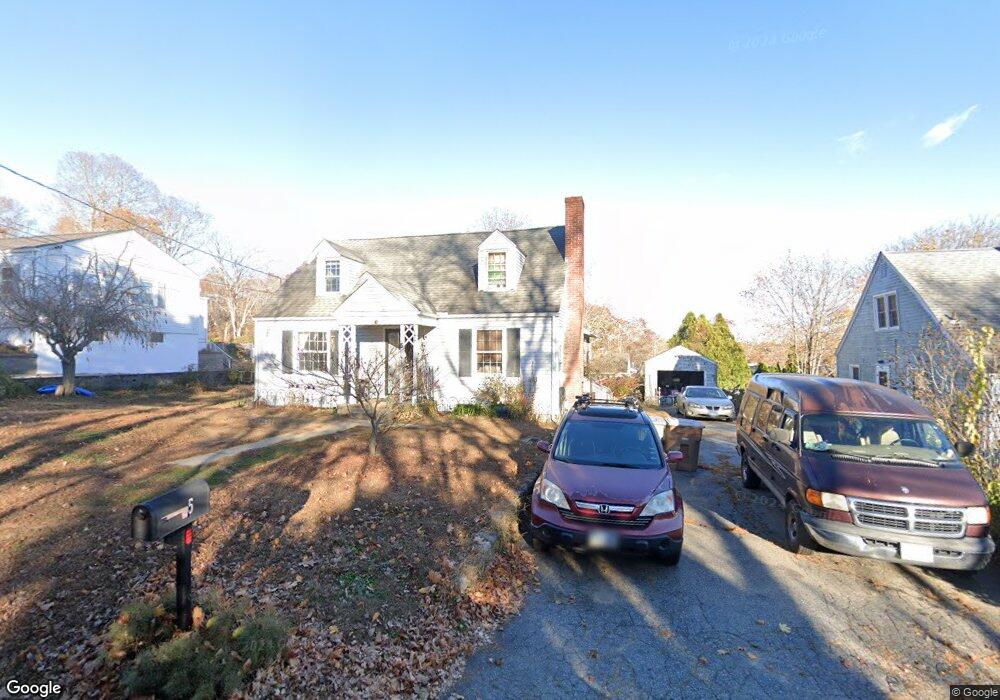
5 Virginia St Niantic, CT 06357
Niantic NeighborhoodEstimated Value: $399,000 - $462,000
3
Beds
2
Baths
1,498
Sq Ft
$289/Sq Ft
Est. Value
About This Home
This home is located at 5 Virginia St, Niantic, CT 06357 and is currently estimated at $433,162, approximately $289 per square foot. 5 Virginia St is a home located in New London County with nearby schools including East Lyme Middle School, East Lyme High School, and The Light House Voc-Ed Center.
Ownership History
Date
Name
Owned For
Owner Type
Purchase Details
Closed on
Aug 1, 1996
Sold by
Cornell Jesse E
Bought by
Obrien John C
Current Estimated Value
Purchase Details
Closed on
May 1, 1995
Sold by
Hagarty Robert N and Hagarty Winifred B
Bought by
Oller Frank and Oller Margaret M
Home Financials for this Owner
Home Financials are based on the most recent Mortgage that was taken out on this home.
Original Mortgage
$113,599
Interest Rate
8.33%
Mortgage Type
Unknown
Create a Home Valuation Report for This Property
The Home Valuation Report is an in-depth analysis detailing your home's value as well as a comparison with similar homes in the area
Home Values in the Area
Average Home Value in this Area
Purchase History
| Date | Buyer | Sale Price | Title Company |
|---|---|---|---|
| Obrien John C | $115,000 | -- | |
| Oller Frank | $114,000 | -- |
Source: Public Records
Mortgage History
| Date | Status | Borrower | Loan Amount |
|---|---|---|---|
| Closed | Oller Frank | $120,000 | |
| Closed | Oller Frank | $116,000 | |
| Previous Owner | Oller Frank | $113,599 |
Source: Public Records
Tax History Compared to Growth
Tax History
| Year | Tax Paid | Tax Assessment Tax Assessment Total Assessment is a certain percentage of the fair market value that is determined by local assessors to be the total taxable value of land and additions on the property. | Land | Improvement |
|---|---|---|---|---|
| 2025 | $5,125 | $182,980 | $78,820 | $104,160 |
| 2024 | $4,822 | $182,980 | $78,820 | $104,160 |
| 2023 | $4,553 | $182,980 | $78,820 | $104,160 |
| 2022 | $4,362 | $182,980 | $78,820 | $104,160 |
| 2021 | $4,087 | $143,360 | $71,330 | $72,030 |
| 2020 | $4,066 | $143,360 | $71,330 | $72,030 |
| 2019 | $4,041 | $143,360 | $71,330 | $72,030 |
| 2018 | $3,921 | $143,360 | $71,330 | $72,030 |
| 2017 | $3,750 | $143,360 | $71,330 | $72,030 |
| 2016 | $3,437 | $135,520 | $67,550 | $67,970 |
| 2015 | $3,349 | $135,520 | $67,550 | $67,970 |
| 2014 | $3,257 | $135,520 | $67,550 | $67,970 |
Source: Public Records
Map
Nearby Homes
- 81 E Pattagansett Rd Unit 52
- 80 E Pattagansett Rd
- 3 Pattagansett Ct
- 20A Bush Hill Dr
- 10 Joyce Ct
- 43 Village Crossing Unit 43
- 46 Village Crossing Unit 46
- 48 Village Crossing Unit 48
- 47 Village Crossing Unit 47
- 3 Village Crossing Unit 3
- 9 Columbus Ave
- 18 Beckwith St
- 68-70 Black Point Rd
- 19 Cove Dr
- 37 Stoneywood Dr
- 22 York Ave
- 171 Main St
- 69 Terrace Ave
- 97 W Main St Unit 78
- 97 W Main St Unit 15
- 3 Virginia St
- 7 Virginia St
- 6 Edlon St
- 4 Edlon St
- 14 Lakeview Dr
- 16 Lakeview Dr
- 10 Virginia St
- 6 Lakeview Dr
- 12 Virginia St
- 8 Lakeview Dr Unit 10
- 15 Lakeview Dr
- 11 Lakeview Dr
- 79 Lakeview Dr
- 7-9 Lakeview Dr
- 17 Lakeview Dr
- 53 E Pattagansett Rd
- 61 E Pattagansett Rd
- 7 Lakeview Dr
- 49 E Pattagansett Rd
- 65 E Pattagansett Rd