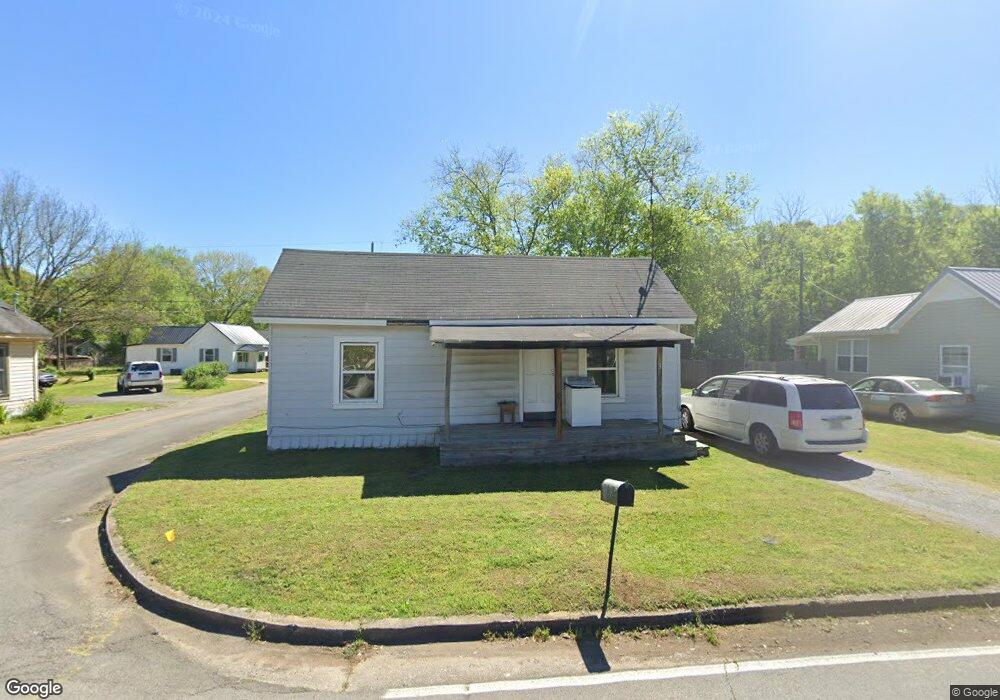
5 Walnut St Aragon, GA 30104
Estimated Value: $103,951 - $147,000
1
Bed
1
Bath
735
Sq Ft
$177/Sq Ft
Est. Value
About This Home
This home is located at 5 Walnut St, Aragon, GA 30104 and is currently estimated at $129,738, approximately $176 per square foot. 5 Walnut St is a home located in Polk County with nearby schools including Rockmart Middle School.
Ownership History
Date
Name
Owned For
Owner Type
Purchase Details
Closed on
May 5, 2004
Sold by
Bishop Michael D and Bishop Lori D
Bought by
Willia Reyolds C and Willia Kenneth E
Current Estimated Value
Purchase Details
Closed on
Feb 23, 2001
Sold by
Fuqua Anthony L* and Bishop Michael D
Bought by
Bishop Michael D and Bishop Lori D
Purchase Details
Closed on
Apr 26, 2000
Sold by
Boswell Stella M
Bought by
Bishop Michael D and Fuqua Anthony L
Purchase Details
Closed on
Apr 23, 2000
Sold by
Eubanks Brenda Gail Stanley Duane Bosw
Bought by
Boswell Stella M
Purchase Details
Closed on
Nov 6, 1996
Sold by
Boswell James Hancel
Bought by
Boswell Stella Mae
Purchase Details
Closed on
Mar 19, 1981
Sold by
Forsyth Danny
Bought by
Boswell James H
Purchase Details
Closed on
Mar 5, 1981
Sold by
Streetman Myles
Bought by
Forsyth Danny
Purchase Details
Closed on
May 25, 1971
Sold by
Martin Earl Ed Mrs
Bought by
Streetman Myles
Purchase Details
Closed on
Jan 22, 1960
Sold by
Brooks Hugh
Bought by
Martin Earl Ed Mrs
Purchase Details
Closed on
Jan 1, 1901
Bought by
Brooks Hugh
Create a Home Valuation Report for This Property
The Home Valuation Report is an in-depth analysis detailing your home's value as well as a comparison with similar homes in the area
Purchase History
| Date | Buyer | Sale Price | Title Company |
|---|---|---|---|
| Willia Reyolds C | $25,000 | -- | |
| Bishop Michael D | $11,400 | -- | |
| Bishop Michael D | $25,000 | -- | |
| Boswell Stella M | -- | -- | |
| Eubanks Brenda Gail Ronald Lamar Bo | -- | -- | |
| Boswell Stella Mae | -- | -- | |
| Boswell James H | -- | -- | |
| Forsyth Danny | -- | -- | |
| Forsyth Danny | -- | -- | |
| Streetman Myles | -- | -- | |
| Martin Earl Ed Mrs | -- | -- | |
| Brooks Hugh | -- | -- |
Source: Public Records
Tax History
| Year | Tax Paid | Tax Assessment Tax Assessment Total Assessment is a certain percentage of the fair market value that is determined by local assessors to be the total taxable value of land and additions on the property. | Land | Improvement |
|---|---|---|---|---|
| 2025 | $905 | $31,233 | $8,000 | $23,233 |
| 2024 | $895 | $31,233 | $8,000 | $23,233 |
| 2023 | $411 | $12,572 | $480 | $12,092 |
| 2022 | $254 | $10,690 | $480 | $10,210 |
| 2021 | $257 | $10,690 | $480 | $10,210 |
| 2020 | $258 | $10,690 | $480 | $10,210 |
| 2019 | $205 | $7,636 | $1,150 | $6,486 |
| 2018 | $205 | $7,424 | $1,150 | $6,274 |
| 2017 | $202 | $7,424 | $1,150 | $6,274 |
| 2016 | $202 | $7,424 | $1,150 | $6,274 |
| 2015 | $210 | $7,676 | $1,150 | $6,526 |
| 2014 | $244 | $8,866 | $2,341 | $6,526 |
Source: Public Records
Map
Nearby Homes
- 30 Oak St
- 19 Walnut St
- 34 Elm St
- 28 Walnut St
- 15 Aragon Rd
- 54 Taylorsville Rd
- 0 Rome Hwy 101 Unit 10445422
- 3 Magnolia St
- 5 Magnolia St
- 11 Magnolia St
- 65 Long Station Rd
- 1638 Prospect Rd
- 70 N Bellview Rd
- 156 Dogwood Glen Dr
- 88 N Bellview Rd
- 2300 Frettiesburg Dr
- 94 Eastwood Path
- 133 N Bellview Rd
- 62 Morgan Rd
- 95 Cashtown Rd
Your Personal Tour Guide
Ask me questions while you tour the home.