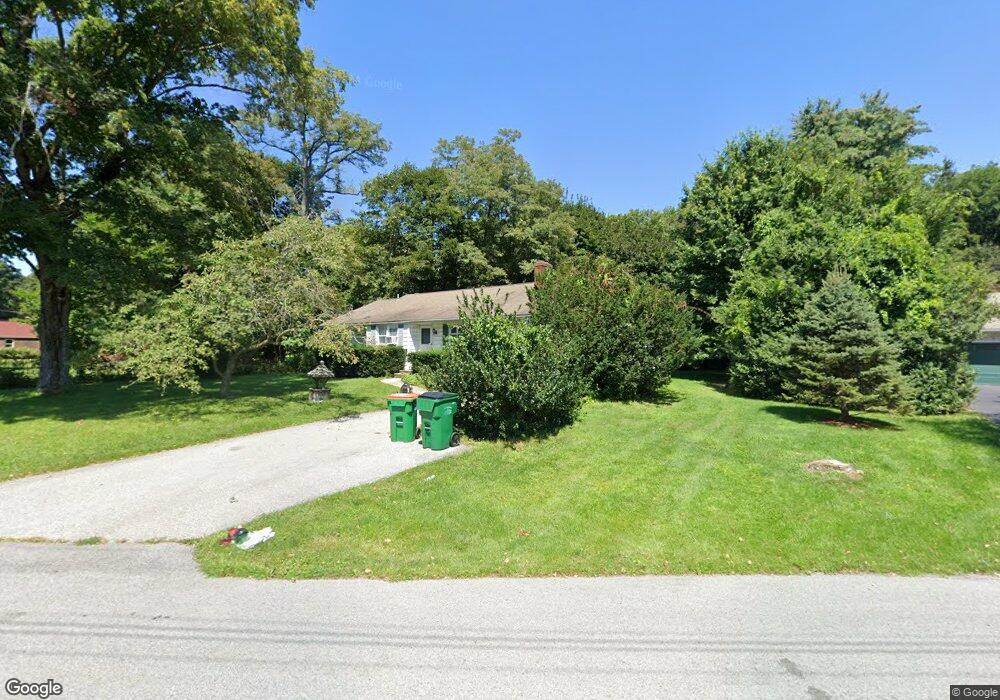
5 Wasson Dr Poughkeepsie, NY 12603
Estimated Value: $323,582 - $411,000
3
Beds
1
Bath
1,423
Sq Ft
$264/Sq Ft
Est. Value
About This Home
This home is located at 5 Wasson Dr, Poughkeepsie, NY 12603 and is currently estimated at $375,396, approximately $263 per square foot. 5 Wasson Dr is a home located in Dutchess County with nearby schools including Oak Grove Elementary School, Wappingers Junior High School, and Roy C. Ketcham Senior High School.
Ownership History
Date
Name
Owned For
Owner Type
Purchase Details
Closed on
Jan 17, 2024
Sold by
Parkour Properties Llc
Bought by
Shields Thomas J
Current Estimated Value
Home Financials for this Owner
Home Financials are based on the most recent Mortgage that was taken out on this home.
Original Mortgage
$290,000
Outstanding Balance
$284,112
Interest Rate
6.95%
Mortgage Type
New Conventional
Estimated Equity
$91,284
Purchase Details
Closed on
Sep 19, 2023
Sold by
Hershman Charles R and Hershman Kristen C
Bought by
Parkour Properties Llc
Purchase Details
Closed on
Mar 24, 2006
Sold by
Le Blanc Estate Oscar
Bought by
Hershman Charles
Home Financials for this Owner
Home Financials are based on the most recent Mortgage that was taken out on this home.
Original Mortgage
$218,900
Interest Rate
6.32%
Mortgage Type
Purchase Money Mortgage
Purchase Details
Closed on
Mar 31, 2000
Sold by
Eyring Frank R and Eyring Adele C
Bought by
Le Blanc Oscar and Le Flora
Purchase Details
Closed on
Jun 2, 1998
Purchase Details
Closed on
Oct 2, 1997
Sold by
Kadar John W and Kadar Marianna R
Bought by
Eyring Frank R and Eyring Adele C
Create a Home Valuation Report for This Property
The Home Valuation Report is an in-depth analysis detailing your home's value as well as a comparison with similar homes in the area
Home Values in the Area
Average Home Value in this Area
Purchase History
| Date | Buyer | Sale Price | Title Company |
|---|---|---|---|
| Shields Thomas J | $362,500 | None Available | |
| Parkour Properties Llc | $206,000 | None Available | |
| Parkour Properties Llc | $206,000 | None Available | |
| Hershman Charles | $308,900 | -- | |
| Hershman Charles | $308,900 | -- | |
| Le Blanc Oscar | $145,000 | Paul R Haynes | |
| Le Blanc Oscar | $145,000 | Paul R Haynes | |
| -- | -- | -- | |
| -- | -- | -- | |
| Eyring Frank R | $128,000 | -- | |
| Eyring Frank R | $128,000 | -- |
Source: Public Records
Mortgage History
| Date | Status | Borrower | Loan Amount |
|---|---|---|---|
| Open | Shields Thomas J | $290,000 | |
| Previous Owner | Hershman Charles | $218,900 |
Source: Public Records
Tax History
| Year | Tax Paid | Tax Assessment Tax Assessment Total Assessment is a certain percentage of the fair market value that is determined by local assessors to be the total taxable value of land and additions on the property. | Land | Improvement |
|---|---|---|---|---|
| 2024 | $8,249 | $286,000 | $67,600 | $218,400 |
| 2023 | $11,246 | $286,000 | $67,600 | $218,400 |
| 2022 | $11,066 | $275,000 | $61,400 | $213,600 |
| 2021 | $10,003 | $229,000 | $61,400 | $167,600 |
| 2020 | $6,283 | $214,000 | $61,400 | $152,600 |
| 2019 | $6,140 | $214,000 | $61,400 | $152,600 |
| 2018 | $5,576 | $190,000 | $61,400 | $128,600 |
| 2017 | $5,365 | $184,000 | $61,400 | $122,600 |
| 2016 | $5,463 | $188,500 | $61,400 | $127,100 |
| 2015 | -- | $188,500 | $65,000 | $123,500 |
| 2014 | -- | $188,500 | $65,000 | $123,500 |
Source: Public Records
Map
Nearby Homes
- 8 Toms Way
- 35 Sandi Dr
- 22 Wendover Dr
- 13 Glen Dr
- 10 Lori St
- 24 Lorraine Blvd
- 5 Wildwood Dr Unit 16D
- 5 Wildwood Dr Unit 8B
- 5 Wildwood Dr Unit 15D
- 5 Wildwood Dr Unit 9A
- 67 Jackson Rd
- 7 Brookland Farms Rd
- 21 Tanglewood Dr
- 8 Woodland Dr
- 39 Liss Rd
- 487 Sheafe Rd
- 621 Sheafe Rd Unit 76
- 34 Brookland Farms Rd
- 413 Vassar Rd
- 84 Hillis Terrace
Your Personal Tour Guide
Ask me questions while you tour the home.