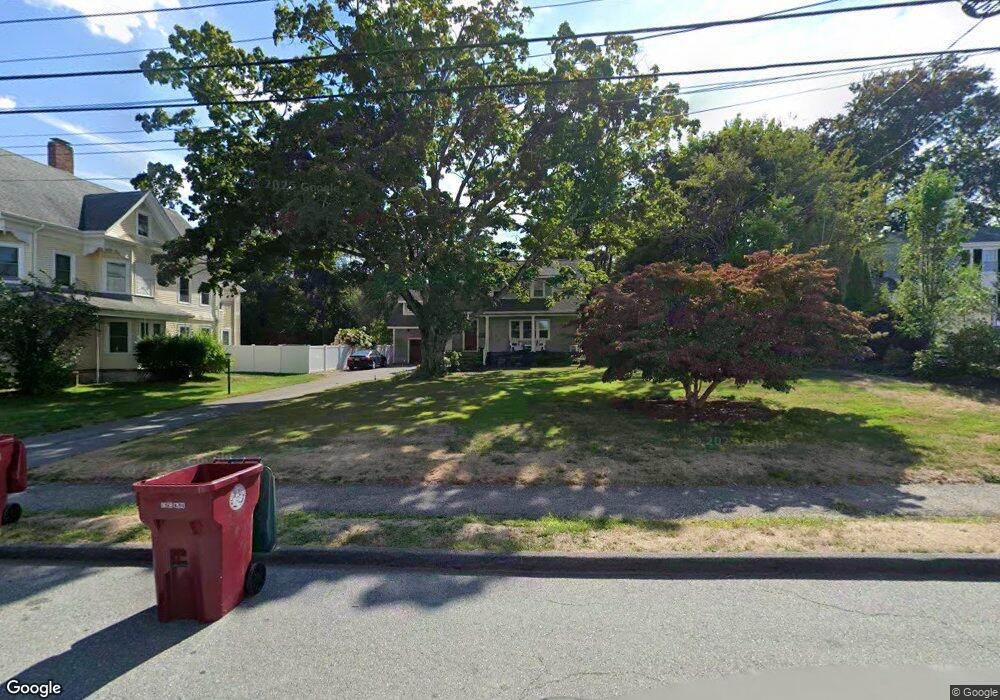
5 Webster St Middleboro, MA 02346
Estimated Value: $575,000 - $794,000
3
Beds
2
Baths
2,376
Sq Ft
$269/Sq Ft
Est. Value
About This Home
This home is located at 5 Webster St, Middleboro, MA 02346 and is currently estimated at $638,590, approximately $268 per square foot. 5 Webster St is a home located in Plymouth County with nearby schools including Mary K. Goode Elementary School and Mullein Hill Christian Academy.
Ownership History
Date
Name
Owned For
Owner Type
Purchase Details
Closed on
Aug 12, 2008
Sold by
Ockers Nancy T and Ockers Matthew A
Bought by
Littlefield Chad A and Littlefield Stephanie A
Current Estimated Value
Home Financials for this Owner
Home Financials are based on the most recent Mortgage that was taken out on this home.
Original Mortgage
$180,000
Interest Rate
6.49%
Mortgage Type
Purchase Money Mortgage
Purchase Details
Closed on
Oct 29, 1999
Sold by
Hartley George E and Hartley Louronne
Bought by
Ockers Nancy T and Ockers Matthew A
Create a Home Valuation Report for This Property
The Home Valuation Report is an in-depth analysis detailing your home's value as well as a comparison with similar homes in the area
Home Values in the Area
Average Home Value in this Area
Purchase History
| Date | Buyer | Sale Price | Title Company |
|---|---|---|---|
| Littlefield Chad A | $338,000 | -- | |
| Ockers Nancy T | $165,000 | -- |
Source: Public Records
Mortgage History
| Date | Status | Borrower | Loan Amount |
|---|---|---|---|
| Open | Ockers Nancy T | $172,000 | |
| Closed | Ockers Nancy T | $180,000 | |
| Previous Owner | Ockers Nancy T | $182,095 |
Source: Public Records
Tax History
| Year | Tax Paid | Tax Assessment Tax Assessment Total Assessment is a certain percentage of the fair market value that is determined by local assessors to be the total taxable value of land and additions on the property. | Land | Improvement |
|---|---|---|---|---|
| 2025 | $6,671 | $497,500 | $167,700 | $329,800 |
| 2024 | $6,345 | $468,600 | $159,700 | $308,900 |
| 2023 | $6,130 | $430,500 | $159,700 | $270,800 |
| 2022 | $5,520 | $358,900 | $138,900 | $220,000 |
| 2021 | $5,494 | $337,700 | $121,900 | $215,800 |
| 2020 | $5,261 | $331,300 | $121,900 | $209,400 |
| 2019 | $4,771 | $308,200 | $121,900 | $186,300 |
| 2018 | $4,772 | $305,900 | $116,100 | $189,800 |
| 2017 | $4,666 | $295,900 | $111,700 | $184,200 |
| 2016 | $4,232 | $265,800 | $102,200 | $163,600 |
| 2015 | $4,134 | $262,000 | $102,200 | $159,800 |
Source: Public Records
Map
Nearby Homes
- 7 Webster St
- 9 Webster St Unit 2
- 9 Webster St
- 9 Webster St Unit 1
- 11 Webster St
- 11 Webster St Unit 2
- 6 Webster St
- 8 Webster St
- 10 Webster St
- 10 Webster St Unit 3
- 10 Webster St Unit 2
- 10 Webster St Unit 1
- 8 Rock St
- 13 Webster St
- 4 Rock St
- 4 Rock St
- 10 Rock St
- 13 Clifford St
- 50 S Main St
- 15 Webster St
Your Personal Tour Guide
Ask me questions while you tour the home.