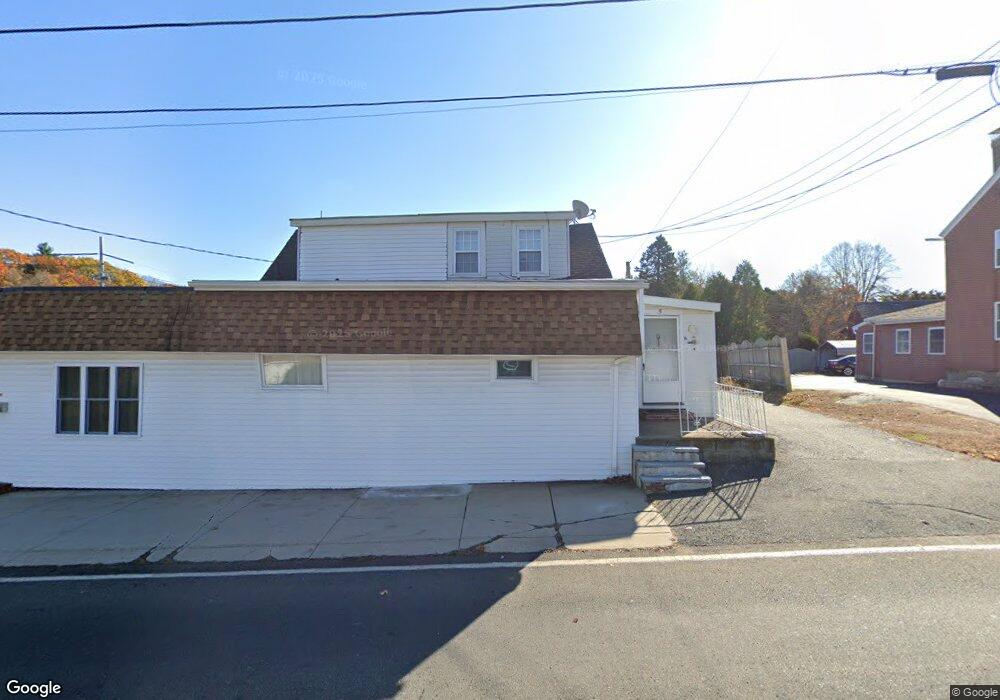
5 Wenham St Danvers, MA 01923
Estimated Value: $676,000 - $912,000
2
Beds
2
Baths
2,878
Sq Ft
$273/Sq Ft
Est. Value
About This Home
This home is located at 5 Wenham St, Danvers, MA 01923 and is currently estimated at $785,858, approximately $273 per square foot. 5 Wenham St is a home located in Essex County with nearby schools including St. Mary of the Annunciation School and St. John's Prep.
Ownership History
Date
Name
Owned For
Owner Type
Purchase Details
Closed on
May 22, 2019
Sold by
Nguyen Rt
Bought by
Hoang Alison and Nguyen Louis P
Current Estimated Value
Home Financials for this Owner
Home Financials are based on the most recent Mortgage that was taken out on this home.
Original Mortgage
$215,710
Outstanding Balance
$189,653
Interest Rate
4.2%
Mortgage Type
FHA
Estimated Equity
$596,205
Purchase Details
Closed on
Aug 21, 2002
Sold by
Comb William C and Comb Joanne L
Bought by
Nguyen Rt
Home Financials for this Owner
Home Financials are based on the most recent Mortgage that was taken out on this home.
Original Mortgage
$225,000
Interest Rate
6.57%
Mortgage Type
Commercial
Purchase Details
Closed on
May 4, 1988
Sold by
Tashjian John
Bought by
Comb William C
Home Financials for this Owner
Home Financials are based on the most recent Mortgage that was taken out on this home.
Original Mortgage
$267,500
Interest Rate
9.94%
Mortgage Type
Commercial
Create a Home Valuation Report for This Property
The Home Valuation Report is an in-depth analysis detailing your home's value as well as a comparison with similar homes in the area
Home Values in the Area
Average Home Value in this Area
Purchase History
| Date | Buyer | Sale Price | Title Company |
|---|---|---|---|
| Hoang Alison | -- | -- | |
| Nguyen Rt | $300,000 | -- | |
| Comb William C | $250,000 | -- |
Source: Public Records
Mortgage History
| Date | Status | Borrower | Loan Amount |
|---|---|---|---|
| Open | Hoang Alison | $215,710 | |
| Previous Owner | Comb William C | $90,000 | |
| Previous Owner | Comb William C | $315,000 | |
| Previous Owner | Comb William C | $225,000 | |
| Previous Owner | Comb William C | $267,500 |
Source: Public Records
Tax History Compared to Growth
Tax History
| Year | Tax Paid | Tax Assessment Tax Assessment Total Assessment is a certain percentage of the fair market value that is determined by local assessors to be the total taxable value of land and additions on the property. | Land | Improvement |
|---|---|---|---|---|
| 2025 | $7,058 | $642,200 | $325,300 | $316,900 |
| 2024 | $6,779 | $610,200 | $315,500 | $294,700 |
| 2023 | $6,881 | $585,600 | $295,800 | $289,800 |
| 2022 | $6,343 | $501,000 | $256,300 | $244,700 |
| 2021 | $6,125 | $458,800 | $236,600 | $222,200 |
| 2020 | $5,741 | $439,600 | $236,600 | $203,000 |
| 2019 | $5,681 | $427,800 | $216,900 | $210,900 |
| 2018 | $4,734 | $349,600 | $216,900 | $132,700 |
| 2017 | $0 | $329,900 | $197,200 | $132,700 |
| 2016 | -- | $329,900 | $197,200 | $132,700 |
| 2015 | -- | $287,700 | $155,000 | $132,700 |
Source: Public Records
Map
Nearby Homes