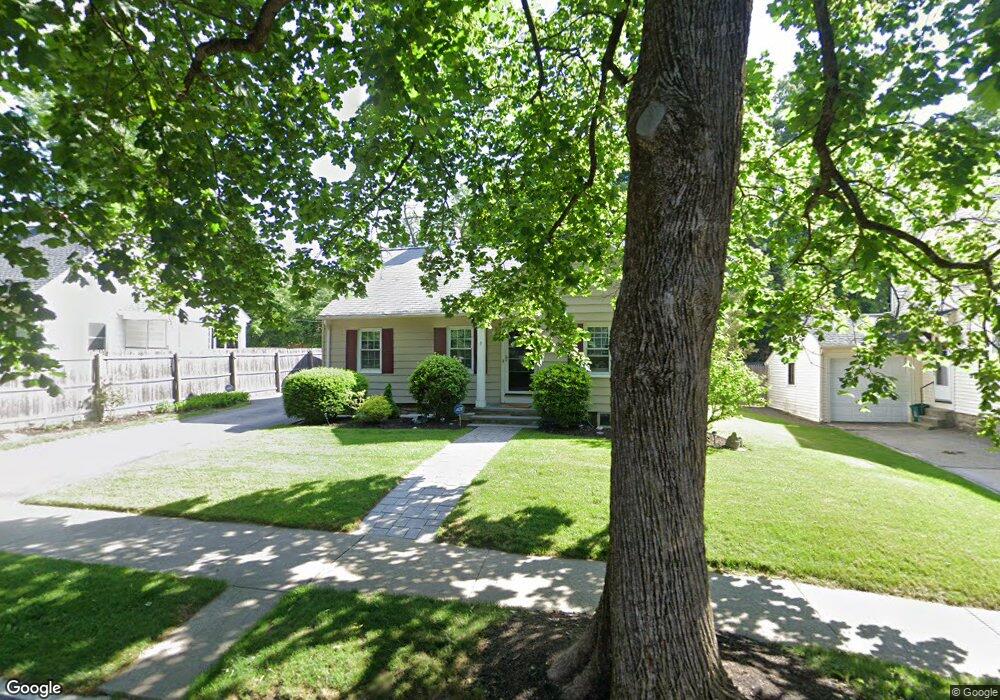
5 Westbrook Rd Worcester, MA 01602
Salisbury Street NeighborhoodEstimated Value: $430,770 - $499,000
3
Beds
1
Bath
1,400
Sq Ft
$332/Sq Ft
Est. Value
About This Home
This home is located at 5 Westbrook Rd, Worcester, MA 01602 and is currently estimated at $465,443, approximately $332 per square foot. 5 Westbrook Rd is a home located in Worcester County with nearby schools including Chandler Magnet, Jacob Hiatt Magnet School, and Flagg Street School.
Ownership History
Date
Name
Owned For
Owner Type
Purchase Details
Closed on
Nov 16, 2011
Sold by
5 Westbrook Road Rt and Brown Thomas M
Bought by
Carey Tr Leslie S and Giblin Brendon P
Current Estimated Value
Home Financials for this Owner
Home Financials are based on the most recent Mortgage that was taken out on this home.
Original Mortgage
$1,927,500
Outstanding Balance
$1,298,308
Interest Rate
3.92%
Mortgage Type
Purchase Money Mortgage
Estimated Equity
-$832,865
Purchase Details
Closed on
May 27, 2010
Sold by
Testa Michael B and Testa Mary L
Bought by
Pasha Stephanie E
Home Financials for this Owner
Home Financials are based on the most recent Mortgage that was taken out on this home.
Original Mortgage
$217,076
Interest Rate
5.5%
Mortgage Type
FHA
Create a Home Valuation Report for This Property
The Home Valuation Report is an in-depth analysis detailing your home's value as well as a comparison with similar homes in the area
Home Values in the Area
Average Home Value in this Area
Purchase History
| Date | Buyer | Sale Price | Title Company |
|---|---|---|---|
| Carey Tr Leslie S | $225,000 | -- | |
| Pasha Stephanie E | $220,000 | -- |
Source: Public Records
Mortgage History
| Date | Status | Borrower | Loan Amount |
|---|---|---|---|
| Open | Carey Tr Leslie S | $1,927,500 | |
| Previous Owner | Pasha Stephanie E | $217,076 |
Source: Public Records
Tax History
| Year | Tax Paid | Tax Assessment Tax Assessment Total Assessment is a certain percentage of the fair market value that is determined by local assessors to be the total taxable value of land and additions on the property. | Land | Improvement |
|---|---|---|---|---|
| 2025 | $5,003 | $379,300 | $121,800 | $257,500 |
| 2024 | $4,907 | $356,900 | $121,800 | $235,100 |
| 2023 | $4,686 | $326,800 | $104,900 | $221,900 |
| 2022 | $4,291 | $282,100 | $83,900 | $198,200 |
| 2021 | $4,111 | $252,500 | $67,100 | $185,400 |
| 2020 | $4,004 | $235,500 | $67,000 | $168,500 |
| 2019 | $3,884 | $215,800 | $64,500 | $151,300 |
| 2018 | $3,895 | $206,000 | $64,500 | $141,500 |
| 2017 | $3,734 | $194,300 | $64,500 | $129,800 |
| 2016 | $3,751 | $182,000 | $52,100 | $129,900 |
| 2015 | $3,653 | $182,000 | $52,100 | $129,900 |
| 2014 | $3,560 | $182,200 | $52,100 | $130,100 |
Source: Public Records
Map
Nearby Homes
- 22 Audubon Rd
- 31 Lenox St
- 9 Dennison Rd
- 32 Aylesbury Rd
- 6 Paul Revere Rd
- 493 Salisbury St
- 8 Old Colony Rd
- 19 Kenilworth Rd
- 23 Orrison St
- 93 Newton Ave N
- 40 Westwood Dr
- 7 Longworth Rd
- 83 Newton Ave N
- 85 Camelot Dr Unit 118
- 18 Merlin Ct Unit 18
- 59 Beechmont St
- 3 Old English Rd
- 163 Moreland St
- 3A Chalmers Rd
- 49 Metcalf St
Your Personal Tour Guide
Ask me questions while you tour the home.