5 Westgate Dr Oxford, MA 01540
Estimated Value: $420,000 - $446,000
4
Beds
1
Bath
1,112
Sq Ft
$388/Sq Ft
Est. Value
About This Home
This home is located at 5 Westgate Dr, Oxford, MA 01540 and is currently estimated at $431,417, approximately $387 per square foot. 5 Westgate Dr is a home located in Worcester County with nearby schools including Alfred M Chaffee, Oxford High School, and Clara Barton Elementary School.
Ownership History
Date
Name
Owned For
Owner Type
Purchase Details
Closed on
Jul 19, 2002
Sold by
Gorman Garrett O and Gorman Dorothy J
Bought by
Bracewell Brian S and Bracewell Tammy J
Current Estimated Value
Home Financials for this Owner
Home Financials are based on the most recent Mortgage that was taken out on this home.
Original Mortgage
$194,750
Outstanding Balance
$82,676
Interest Rate
6.73%
Mortgage Type
Purchase Money Mortgage
Estimated Equity
$348,741
Purchase Details
Closed on
Sep 12, 2000
Sold by
Stjean Dennis M and Stjean Susan M
Bought by
Gorman Garrett O and Gorman Dorothy J
Home Financials for this Owner
Home Financials are based on the most recent Mortgage that was taken out on this home.
Original Mortgage
$161,667
Interest Rate
8.1%
Mortgage Type
Purchase Money Mortgage
Purchase Details
Closed on
Apr 26, 1989
Sold by
Sabacinski Michael
Bought by
Stjean Dennis M
Create a Home Valuation Report for This Property
The Home Valuation Report is an in-depth analysis detailing your home's value as well as a comparison with similar homes in the area
Home Values in the Area
Average Home Value in this Area
Purchase History
| Date | Buyer | Sale Price | Title Company |
|---|---|---|---|
| Bracewell Brian S | $205,000 | -- | |
| Gorman Garrett O | $163,000 | -- | |
| Stjean Dennis M | $129,900 | -- |
Source: Public Records
Mortgage History
| Date | Status | Borrower | Loan Amount |
|---|---|---|---|
| Open | Stjean Dennis M | $194,750 | |
| Previous Owner | Stjean Dennis M | $161,359 | |
| Previous Owner | Stjean Dennis M | $161,667 |
Source: Public Records
Tax History
| Year | Tax Paid | Tax Assessment Tax Assessment Total Assessment is a certain percentage of the fair market value that is determined by local assessors to be the total taxable value of land and additions on the property. | Land | Improvement |
|---|---|---|---|---|
| 2025 | $50 | $398,400 | $90,500 | $307,900 |
| 2024 | $4,780 | $354,600 | $84,100 | $270,500 |
| 2023 | $4,860 | $356,300 | $80,400 | $275,900 |
| 2022 | $4,733 | $292,900 | $78,000 | $214,900 |
| 2021 | $4,390 | $265,600 | $74,000 | $191,600 |
| 2020 | $4,230 | $253,900 | $74,000 | $179,900 |
| 2019 | $3,811 | $223,800 | $74,000 | $149,800 |
| 2018 | $3,622 | $209,700 | $74,000 | $135,700 |
| 2017 | $3,569 | $211,800 | $70,900 | $140,900 |
| 2016 | $3,586 | $211,800 | $70,900 | $140,900 |
| 2015 | $3,344 | $211,800 | $70,900 | $140,900 |
| 2014 | $3,258 | $217,200 | $69,100 | $148,100 |
Source: Public Records
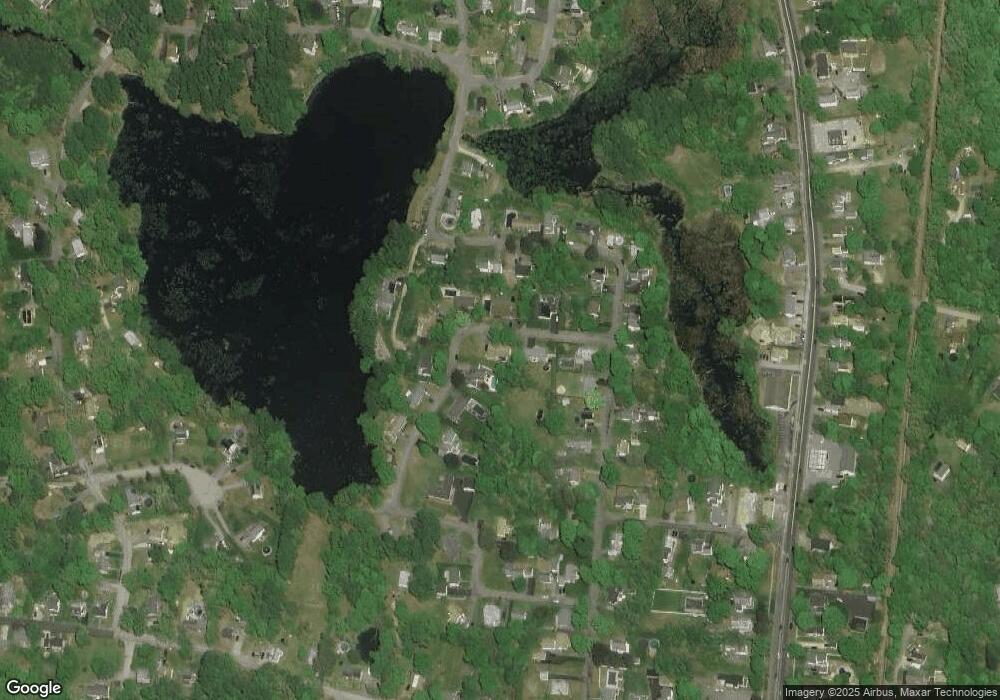
Map
Nearby Homes
Your Personal Tour Guide
Ask me questions while you tour the home.