M
Seller's Agent in 2025
Maxwell Zukowitz
Glasshouse Realty Group
(937) 307-1556
1 in this area
2 Total Sales
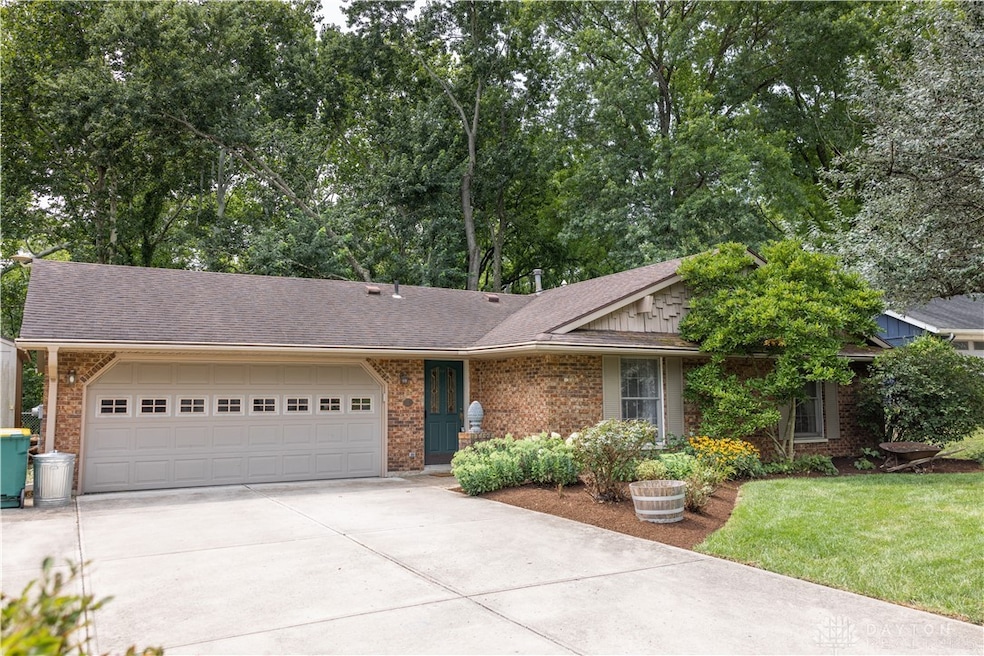
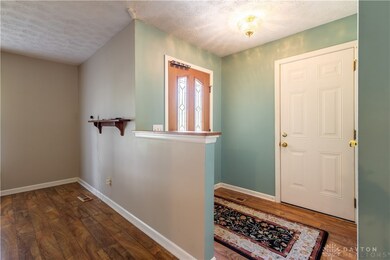
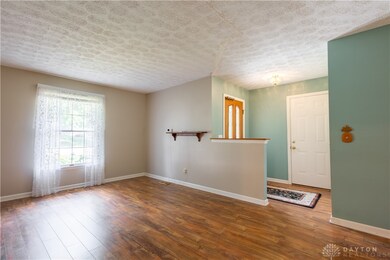
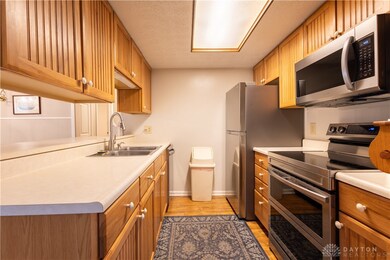
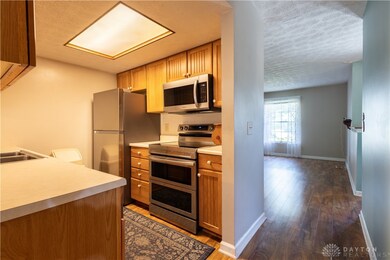
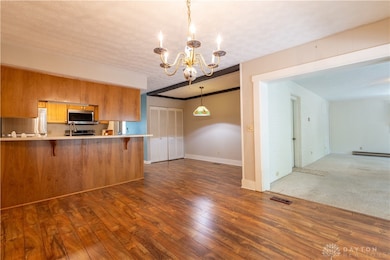
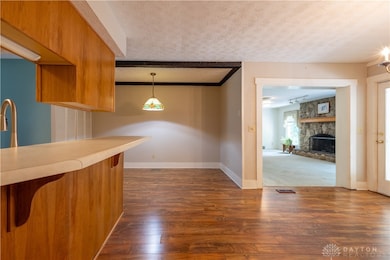
Welcome to this charming 3 bedroom, 2 bath ranch, located in the Tamarack Hills neighborhood. As you step inside you will see this functional lay out, practical for everyday living. As you make your way into the kitchen you will notice the beautiful stainless steel appliances. Off to the left you will have a gorgeous stone fireplace, perfect for relaxing after a long day. Make your way out to the Florida room and you will find the true beauty of this property. Full glass wall with multiple sliding doors leads out onto the oversized deck, that looks over the creek and wooded property. Perfect for an evening drink, or relaxing and entertaining guests. No rear neighbors.
As always, rely on your own measurements.
Last Agent to Sell the Property
Glasshouse Realty Group Brokerage Phone: (937) 828-4856 Listed on: 08/06/2025

| Date | Type | Sale Price | Title Company |
|---|---|---|---|
| Executors Deed | $315,000 | None Listed On Document | |
| Interfamily Deed Transfer | -- | Attorney | |
| Deed | $131,500 | -- | |
| Deed | $116,850 | -- | |
| Deed | $67,000 | -- | |
| Deed | $63,000 | -- |
| Date | Status | Loan Amount | Loan Type |
|---|---|---|---|
| Open | $305,550 | New Conventional | |
| Previous Owner | $93,480 | New Conventional |
| Date | Event | Price | List to Sale | Price per Sq Ft |
|---|---|---|---|---|
| 09/22/2025 09/22/25 | Sold | $315,000 | 0.0% | $186 / Sq Ft |
| 08/12/2025 08/12/25 | Pending | -- | -- | -- |
| 08/06/2025 08/06/25 | For Sale | $315,000 | -- | $186 / Sq Ft |
| Year | Tax Paid | Tax Assessment Tax Assessment Total Assessment is a certain percentage of the fair market value that is determined by local assessors to be the total taxable value of land and additions on the property. | Land | Improvement |
|---|---|---|---|---|
| 2024 | $3,102 | $89,230 | $26,250 | $62,980 |
| 2023 | $2,613 | $70,119 | $16,520 | $53,599 |
| 2022 | $2,575 | $70,119 | $16,520 | $53,599 |
| 2021 | $2,396 | $70,119 | $16,520 | $53,599 |
| 2020 | $2,263 | $59,423 | $14,000 | $45,423 |
| 2019 | $2,087 | $59,423 | $14,000 | $45,423 |
| 2018 | $2,088 | $59,423 | $14,000 | $45,423 |
| 2017 | $1,851 | $49,196 | $11,771 | $37,426 |
| 2016 | $1,930 | $49,196 | $11,771 | $37,426 |
| 2015 | $1,934 | $49,196 | $11,771 | $37,426 |
| 2014 | $1,946 | $47,310 | $11,320 | $35,990 |
| 2013 | $1,945 | $58,520 | $14,000 | $44,520 |
M
Seller's Agent in 2025
Maxwell Zukowitz
Glasshouse Realty Group
(937) 307-1556
1 in this area
2 Total Sales
Buyer's Agent in 2025
Sheree Marcum
Comey & Shepherd REALTORS
(513) 617-5371
1 in this area
100 Total Sales
Source: Dayton REALTORS®
MLS Number: 940705
APN: 04-14-326-002
Disclaimer: Certain information contained herein is derived from information provided by parties other than Homes.com. All information provided is deemed reliable, but is not guaranteed to be accurate and should be independently verified.
![]() The information is being provided by Dayton Area Board of Realtors MLS. Information deemed reliable but not guaranteed. Information is provided for the consumer's personal, non-commercial use, and may not be used for any purpose other than the identification of potential properties for purchase. Copyright 2025 Dayton Area Board of Realtors MLS. All Rights Reserved.
The information is being provided by Dayton Area Board of Realtors MLS. Information deemed reliable but not guaranteed. Information is provided for the consumer's personal, non-commercial use, and may not be used for any purpose other than the identification of potential properties for purchase. Copyright 2025 Dayton Area Board of Realtors MLS. All Rights Reserved.