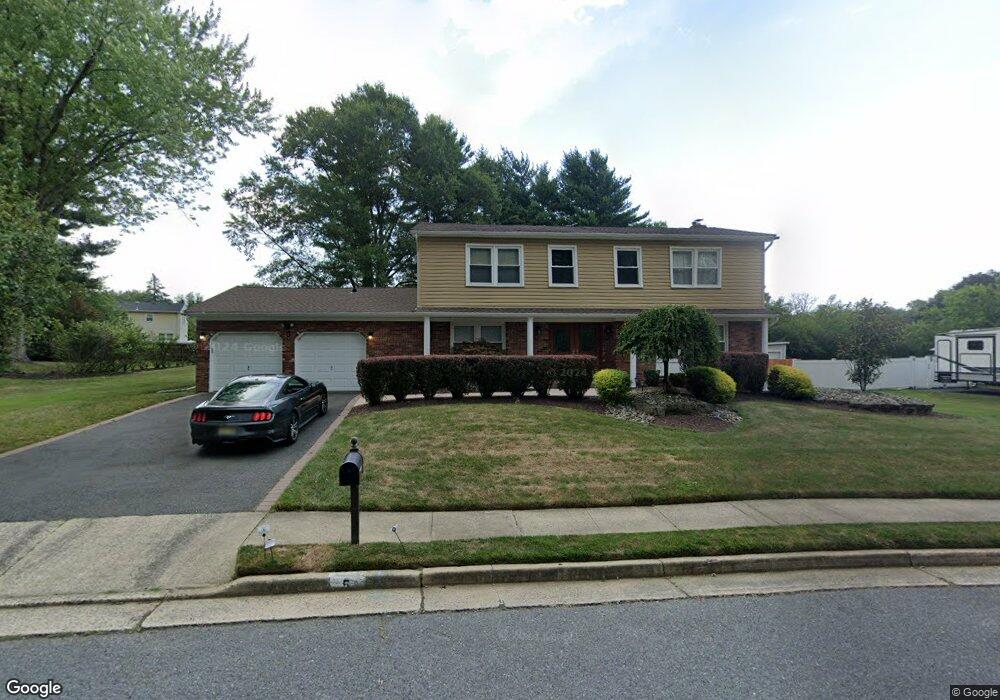
5 Whitney Dr Marlboro, NJ 07746
Estimated Value: $833,211 - $941,000
4
Beds
2
Baths
2,265
Sq Ft
$392/Sq Ft
Est. Value
About This Home
This home is located at 5 Whitney Dr, Marlboro, NJ 07746 and is currently estimated at $888,053, approximately $392 per square foot. 5 Whitney Dr is a home located in Monmouth County with nearby schools including Asher Holmes Elementary School, Marlboro Middle School, and Marlboro High School.
Ownership History
Date
Name
Owned For
Owner Type
Purchase Details
Closed on
Aug 25, 2003
Sold by
Terminiello Scott
Bought by
Brandwene Robert and Brandwene Nicole
Current Estimated Value
Home Financials for this Owner
Home Financials are based on the most recent Mortgage that was taken out on this home.
Original Mortgage
$322,700
Outstanding Balance
$149,622
Interest Rate
6.35%
Estimated Equity
$738,431
Purchase Details
Closed on
Dec 17, 1998
Sold by
Messinger Richard
Bought by
Terminiello Scott and Terminiello Sandra
Home Financials for this Owner
Home Financials are based on the most recent Mortgage that was taken out on this home.
Original Mortgage
$218,500
Interest Rate
6.74%
Create a Home Valuation Report for This Property
The Home Valuation Report is an in-depth analysis detailing your home's value as well as a comparison with similar homes in the area
Home Values in the Area
Average Home Value in this Area
Purchase History
| Date | Buyer | Sale Price | Title Company |
|---|---|---|---|
| Brandwene Robert | $422,000 | -- | |
| Terminiello Scott | $230,000 | -- |
Source: Public Records
Mortgage History
| Date | Status | Borrower | Loan Amount |
|---|---|---|---|
| Open | Brandwene Robert | $322,700 | |
| Previous Owner | Terminiello Scott | $218,500 |
Source: Public Records
Tax History
| Year | Tax Paid | Tax Assessment Tax Assessment Total Assessment is a certain percentage of the fair market value that is determined by local assessors to be the total taxable value of land and additions on the property. | Land | Improvement |
|---|---|---|---|---|
| 2025 | $10,692 | $428,700 | $193,400 | $235,300 |
| 2024 | $10,220 | $428,700 | $193,400 | $235,300 |
Source: Public Records
Map
Nearby Homes
- 3 Alberta Dr
- 5 Washington Ave
- 1 Ciafardini Ct
- 141 Micki Dr
- 4 Canadian Woods Rd
- 4 Forest Ct
- 34 Brookside Cir
- 11 Liberty Rd
- 17 Emerald Dr
- 9 Fairview Rd
- 11 Woodview Dr
- 99 Caldwell Terrace
- 54 Tracy Dr
- 69 School Rd W
- 40 Caldwell Terrace
- 83 Clubhouse Ln
- 211 Bradwick Way
- 25 Highland Dr
- 41 Longstreet Rd
- 407 Edinburgh Place
Your Personal Tour Guide
Ask me questions while you tour the home.