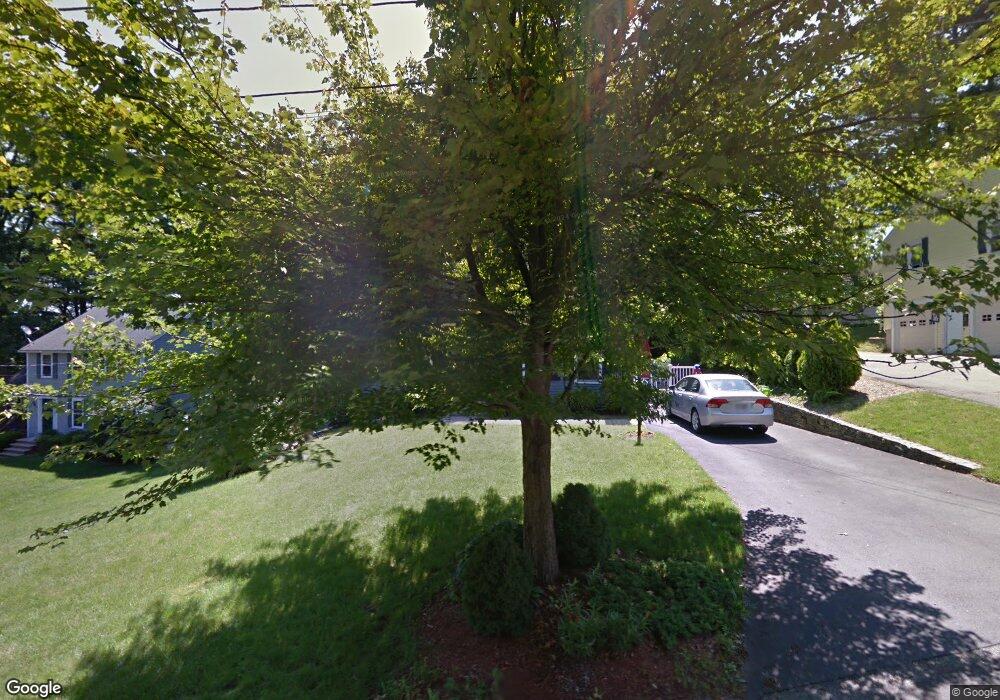
5 Winter Hill Ln Methuen, MA 01844
Downtown Methuen NeighborhoodEstimated Value: $602,000 - $720,000
3
Beds
2
Baths
1,632
Sq Ft
$397/Sq Ft
Est. Value
About This Home
This home is located at 5 Winter Hill Ln, Methuen, MA 01844 and is currently estimated at $647,569, approximately $396 per square foot. 5 Winter Hill Ln is a home located in Essex County with nearby schools including Mendota Elementary School, Tenney Grammar School, and South Point Elementary School.
Ownership History
Date
Name
Owned For
Owner Type
Purchase Details
Closed on
Oct 31, 2002
Sold by
Echteler David A and Echteler Lisa A
Bought by
Munroe-Danehy Stacy L and Danehy Kevin C
Current Estimated Value
Home Financials for this Owner
Home Financials are based on the most recent Mortgage that was taken out on this home.
Original Mortgage
$228,000
Outstanding Balance
$95,991
Interest Rate
6.09%
Mortgage Type
Purchase Money Mortgage
Estimated Equity
$551,578
Create a Home Valuation Report for This Property
The Home Valuation Report is an in-depth analysis detailing your home's value as well as a comparison with similar homes in the area
Home Values in the Area
Average Home Value in this Area
Purchase History
| Date | Buyer | Sale Price | Title Company |
|---|---|---|---|
| Munroe-Danehy Stacy L | $285,000 | -- | |
| Munroe-Danehy Stacy L | $285,000 | -- |
Source: Public Records
Mortgage History
| Date | Status | Borrower | Loan Amount |
|---|---|---|---|
| Open | Munroe-Danehy Stacy L | $228,000 | |
| Closed | Munroe-Danehy Stacy L | $228,000 | |
| Previous Owner | Munroe-Danehy Stacy L | $197,000 | |
| Previous Owner | Munroe-Danehy Stacy L | $98,000 |
Source: Public Records
Tax History Compared to Growth
Tax History
| Year | Tax Paid | Tax Assessment Tax Assessment Total Assessment is a certain percentage of the fair market value that is determined by local assessors to be the total taxable value of land and additions on the property. | Land | Improvement |
|---|---|---|---|---|
| 2025 | $5,837 | $551,700 | $217,100 | $334,600 |
| 2024 | $5,870 | $540,500 | $198,100 | $342,400 |
| 2023 | $5,285 | $451,700 | $176,100 | $275,600 |
| 2022 | $4,984 | $381,900 | $146,700 | $235,200 |
| 2021 | $4,729 | $358,500 | $139,400 | $219,100 |
| 2020 | $4,731 | $352,000 | $139,400 | $212,600 |
| 2019 | $4,565 | $321,700 | $124,700 | $197,000 |
| 2018 | $4,448 | $311,700 | $124,700 | $187,000 |
| 2017 | $4,273 | $291,700 | $124,700 | $167,000 |
| 2016 | $3,965 | $267,700 | $117,400 | $150,300 |
| 2015 | $3,787 | $259,400 | $117,400 | $142,000 |
Source: Public Records
Map
Nearby Homes