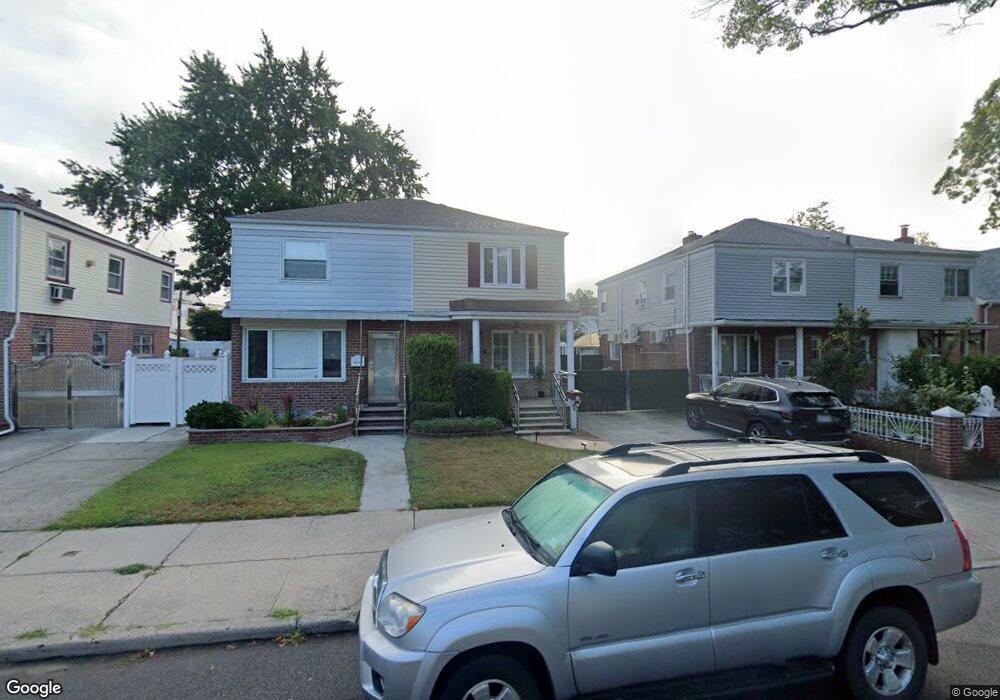
50-19 Francis Lewis Blvd Flushing, NY 11364
Auburndale NeighborhoodEstimated Value: $767,000 - $862,000
2
Beds
3
Baths
1,040
Sq Ft
$805/Sq Ft
Est. Value
About This Home
This home is located at 50-19 Francis Lewis Blvd, Flushing, NY 11364 and is currently estimated at $837,573, approximately $805 per square foot. 50-19 Francis Lewis Blvd is a home located in Queens County with nearby schools including P.S. 162 The John Golden School, M.S. 158 - Marie Curie, and Francis Lewis High School.
Ownership History
Date
Name
Owned For
Owner Type
Purchase Details
Closed on
Aug 25, 2021
Sold by
Mueses Phyllis and Mueses Rene
Bought by
Park Da Young and Wu Johnson Zhi
Current Estimated Value
Home Financials for this Owner
Home Financials are based on the most recent Mortgage that was taken out on this home.
Original Mortgage
$465,000
Outstanding Balance
$423,115
Interest Rate
2.8%
Mortgage Type
Purchase Money Mortgage
Estimated Equity
$414,458
Purchase Details
Closed on
Jan 18, 2000
Sold by
Kochis Vivian V
Bought by
Mueses Rene and Mueses Phyllis
Home Financials for this Owner
Home Financials are based on the most recent Mortgage that was taken out on this home.
Original Mortgage
$152,000
Interest Rate
7.91%
Purchase Details
Closed on
Nov 8, 1996
Sold by
Kochis Vivian V and Viaggio Blanche G
Bought by
Kochis
Create a Home Valuation Report for This Property
The Home Valuation Report is an in-depth analysis detailing your home's value as well as a comparison with similar homes in the area
Home Values in the Area
Average Home Value in this Area
Purchase History
| Date | Buyer | Sale Price | Title Company |
|---|---|---|---|
| Park Da Young | $765,000 | -- | |
| Park Da Young | $765,000 | -- | |
| Mueses Rene | $190,000 | Commonwealth Land Title Ins | |
| Mueses Rene | $190,000 | Commonwealth Land Title Ins | |
| Kochis | -- | First American Title Ins Co | |
| Kochis Vivian V | -- | First American Title Ins Co |
Source: Public Records
Mortgage History
| Date | Status | Borrower | Loan Amount |
|---|---|---|---|
| Open | Park Da Young | $465,000 | |
| Closed | Park Da Young | $465,000 | |
| Previous Owner | Mueses Rene | $152,000 |
Source: Public Records
Tax History Compared to Growth
Tax History
| Year | Tax Paid | Tax Assessment Tax Assessment Total Assessment is a certain percentage of the fair market value that is determined by local assessors to be the total taxable value of land and additions on the property. | Land | Improvement |
|---|---|---|---|---|
| 2025 | $7,492 | $39,539 | $10,479 | $29,060 |
| 2024 | $7,492 | $37,301 | $10,260 | $27,041 |
| 2023 | $7,068 | $35,191 | $9,008 | $26,183 |
| 2022 | $6,636 | $47,160 | $13,500 | $33,660 |
| 2021 | $6,679 | $48,660 | $13,500 | $35,160 |
| 2020 | $6,678 | $46,560 | $13,500 | $33,060 |
| 2019 | $6,210 | $48,300 | $13,500 | $34,800 |
| 2018 | $5,680 | $29,326 | $9,373 | $19,953 |
| 2017 | $5,347 | $27,702 | $9,387 | $18,315 |
| 2016 | $5,211 | $27,702 | $9,387 | $18,315 |
| 2015 | $2,932 | $27,458 | $12,903 | $14,555 |
| 2014 | $2,932 | $25,904 | $13,867 | $12,037 |
Source: Public Records
Map
Nearby Homes
- 4843 201st St
- 50-15 199th St
- 48-18 202nd St
- 53-12 199th St
- 19715 53rd Ave
- 48-35 Clearview Expy
- 53-40 198th St
- 199-04 47th Ave
- 198-01 56th Ave
- 48-46 206th St Unit 2
- 47-11 197th St
- 47-24 197th St
- 56-39 Francis Lewis Blvd
- 5640 Francis Lewis Blvd
- 46-38 204th St
- 47-65 196th St
- 4732 207th St
- 5802 201st St
- 47-52 196th St
- 47-69 195th St
- 5019 Francis Lewis Blvd
- 5021 Francis Lewis Blvd
- 5017 Francis Lewis Blvd
- 5023 Francis Lewis Blvd
- 5015 Francis Lewis Blvd
- 5027 Francis Lewis Blvd
- 5027 Francis Lewis Blvd
- 5011 Francis Lewis Blvd
- 5033 Francis Lewis Blvd
- 5022 201st St
- 5020 201st St
- 5024 201st St
- 50-09 Francis Lewis Blvd
- 5022 201st St
- 5016 201st St
- 5024 201st St
- 5026 201st St
- 5009 Francis Lewis Blvd
- 5009 Francis Lewis Blvd
- 50-33 Francis Lewis Blvd