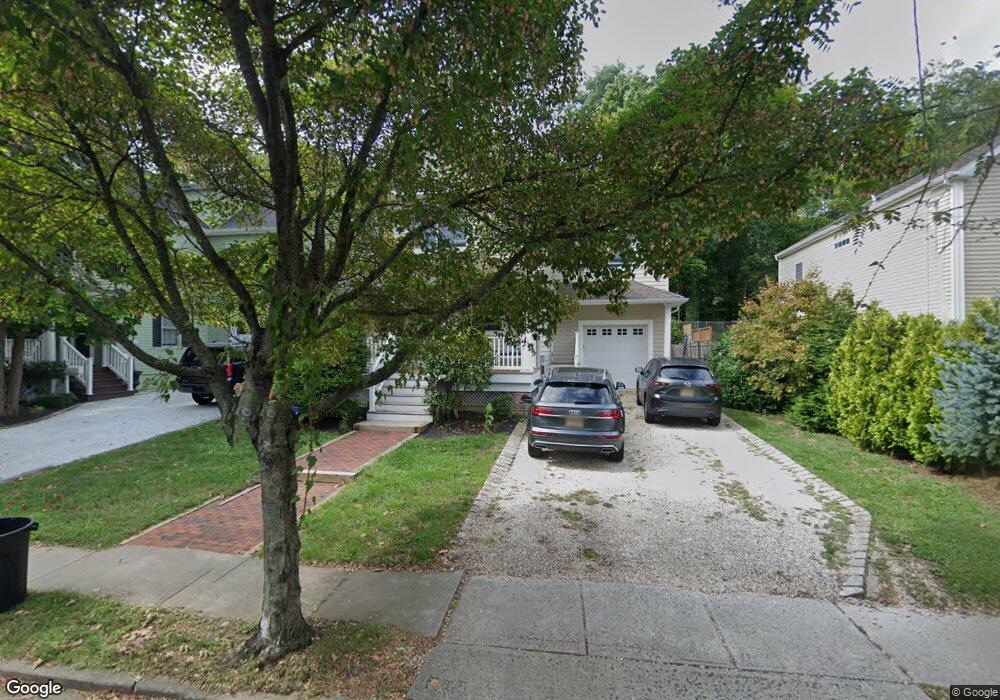
50 Allen St Rumson, NJ 07760
Estimated Value: $1,511,000 - $1,646,000
3
Beds
3
Baths
2,354
Sq Ft
$670/Sq Ft
Est. Value
About This Home
This home is located at 50 Allen St, Rumson, NJ 07760 and is currently estimated at $1,578,118, approximately $670 per square foot. 50 Allen St is a home located in Monmouth County with nearby schools including Deane Porter School, Forrestdale School, and Rumson Fair Haven Regional High School.
Ownership History
Date
Name
Owned For
Owner Type
Purchase Details
Closed on
Nov 10, 2003
Sold by
Rumson Design
Bought by
Dumont Carl and Dumont Lisa
Current Estimated Value
Home Financials for this Owner
Home Financials are based on the most recent Mortgage that was taken out on this home.
Original Mortgage
$468,000
Interest Rate
5.98%
Purchase Details
Closed on
May 25, 2002
Sold by
Scofii Louis
Bought by
Rumson Design
Create a Home Valuation Report for This Property
The Home Valuation Report is an in-depth analysis detailing your home's value as well as a comparison with similar homes in the area
Home Values in the Area
Average Home Value in this Area
Purchase History
| Date | Buyer | Sale Price | Title Company |
|---|---|---|---|
| Dumont Carl | $585,140 | -- | |
| Rumson Design | $210,000 | -- |
Source: Public Records
Mortgage History
| Date | Status | Borrower | Loan Amount |
|---|---|---|---|
| Previous Owner | Dumont Carl | $468,000 |
Source: Public Records
Tax History Compared to Growth
Tax History
| Year | Tax Paid | Tax Assessment Tax Assessment Total Assessment is a certain percentage of the fair market value that is determined by local assessors to be the total taxable value of land and additions on the property. | Land | Improvement |
|---|---|---|---|---|
| 2025 | $13,500 | $1,330,200 | $731,000 | $599,200 |
| 2024 | $13,453 | $1,227,300 | $682,000 | $545,300 |
| 2023 | $13,453 | $1,150,800 | $656,500 | $494,300 |
| 2022 | $12,663 | $1,047,900 | $583,500 | $464,400 |
| 2021 | $12,663 | $889,900 | $504,000 | $385,900 |
| 2020 | $11,938 | $833,100 | $465,000 | $368,100 |
| 2019 | $11,291 | $768,600 | $272,800 | $495,800 |
| 2018 | $11,050 | $745,600 | $272,800 | $472,800 |
| 2017 | $10,354 | $704,800 | $246,400 | $458,400 |
| 2016 | $9,934 | $693,200 | $246,400 | $446,800 |
| 2015 | $9,779 | $673,000 | $246,400 | $426,600 |
| 2014 | $9,574 | $657,100 | $242,000 | $415,100 |
Source: Public Records
Map
Nearby Homes