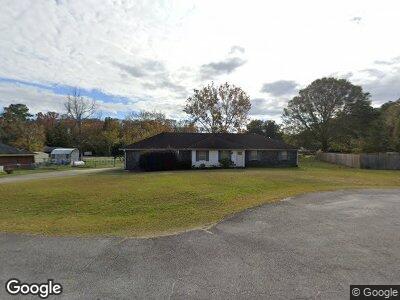
50 Ashlynn Ln Midway, GA 31320
Estimated Value: $237,000 - $265,071
3
Beds
2
Baths
1,849
Sq Ft
$136/Sq Ft
Est. Value
About This Home
This home is located at 50 Ashlynn Ln, Midway, GA 31320 and is currently estimated at $250,768, approximately $135 per square foot. 50 Ashlynn Ln is a home located in Liberty County with nearby schools including Liberty Elementary School, Midway Middle School, and Liberty County High School.
Ownership History
Date
Name
Owned For
Owner Type
Purchase Details
Closed on
Jul 29, 2010
Sold by
Weisbarth Larry J
Bought by
Allen Aimee R and Hamilton Daniel L
Current Estimated Value
Home Financials for this Owner
Home Financials are based on the most recent Mortgage that was taken out on this home.
Original Mortgage
$128,300
Interest Rate
4.75%
Mortgage Type
FHA
Purchase Details
Closed on
Jun 11, 1997
Sold by
Negron Rosendo and Negron Peg
Bought by
Weisbarth Larry J and Weisbarth Michelle R
Purchase Details
Closed on
Sep 3, 1996
Sold by
Citicorp Mortgage Inc
Bought by
Sec Of V A
Purchase Details
Closed on
Jan 31, 1994
Bought by
Negron Rosendo and Negron Peggy L
Purchase Details
Closed on
Oct 5, 1993
Bought by
Dykes Keith
Create a Home Valuation Report for This Property
The Home Valuation Report is an in-depth analysis detailing your home's value as well as a comparison with similar homes in the area
Home Values in the Area
Average Home Value in this Area
Purchase History
| Date | Buyer | Sale Price | Title Company |
|---|---|---|---|
| Allen Aimee R | $133,000 | -- | |
| Weisbarth Larry J | $72,600 | -- | |
| Sec Of V A | -- | -- | |
| Citicorp Mortgage Inc | -- | -- | |
| Negron Rosendo | $77,300 | -- | |
| Dykes Keith | $8,500 | -- |
Source: Public Records
Mortgage History
| Date | Status | Borrower | Loan Amount |
|---|---|---|---|
| Open | Allen Aimee R | $188,000 | |
| Closed | Allen Aimee R | $128,300 | |
| Previous Owner | Weisbarth Larry J | $164,350 | |
| Previous Owner | Weisbarth Larry J | $127,500 | |
| Previous Owner | Weisbarth Larry J | $122,000 |
Source: Public Records
Tax History Compared to Growth
Tax History
| Year | Tax Paid | Tax Assessment Tax Assessment Total Assessment is a certain percentage of the fair market value that is determined by local assessors to be the total taxable value of land and additions on the property. | Land | Improvement |
|---|---|---|---|---|
| 2024 | $3,739 | $89,489 | $12,000 | $77,489 |
| 2023 | $3,739 | $80,514 | $12,000 | $68,514 |
| 2022 | $2,611 | $66,526 | $11,200 | $55,326 |
| 2021 | $2,367 | $60,412 | $11,200 | $49,212 |
| 2020 | $2,040 | $51,734 | $10,000 | $41,734 |
| 2019 | $2,007 | $52,256 | $10,000 | $42,256 |
| 2018 | $2,003 | $52,776 | $10,000 | $42,776 |
| 2017 | $1,894 | $57,504 | $10,000 | $47,504 |
| 2016 | $1,903 | $53,820 | $10,000 | $43,820 |
| 2015 | $2,005 | $53,820 | $10,000 | $43,820 |
| 2014 | $2,005 | $56,189 | $10,000 | $46,189 |
| 2013 | -- | $51,960 | $10,000 | $41,960 |
Source: Public Records
Map
Nearby Homes
- 9 Ashlynn Ln
- 124 Denham Ln
- 124 Denham Ln
- 0 E Oglethorpe Unit 153327
- 327 River Bend Dr
- 0000 E Oglethorpe Hwy
- 0 S Coastal Hwy
- 1931 S Coastal Hwy
- 175 U S 17
- 1022 Stone Ct
- 984 Stone Ct
- 1123 Stone Ct
- 821 Stone Ct
- 794 Stone Ct
- 178 Holland Dr
- 259 Buckingham Dr
- 1979 S Coastal Hwy
- 907 Stone Ct
- 907 Stone St
- 728 Stone Ct
- 50 Ashlynn Ln
- 16 Ashlynn Ln
- 187 Cross Creek Dr
- 60 Ashlynn Ln
- 49 Ashlynn Ln
- 205 Cross Creek Dr
- 29 Ashlynn Ln
- 61 Ashlynn Ln
- 0 Cross Creek Dr Unit 7225047
- 0 Cross Creek Dr
- 11 Logan Ct
- 146 Cross Creek Dr
- 166 Cross Creek Dr
- 126 Cross Creek Dr
- 204 Cross Creek Dr
- 19 Logan Ct
- 186 Cross Creek Dr
- 64 Garman Ln
- 44 Garman Ln
- 76 Garman Ln