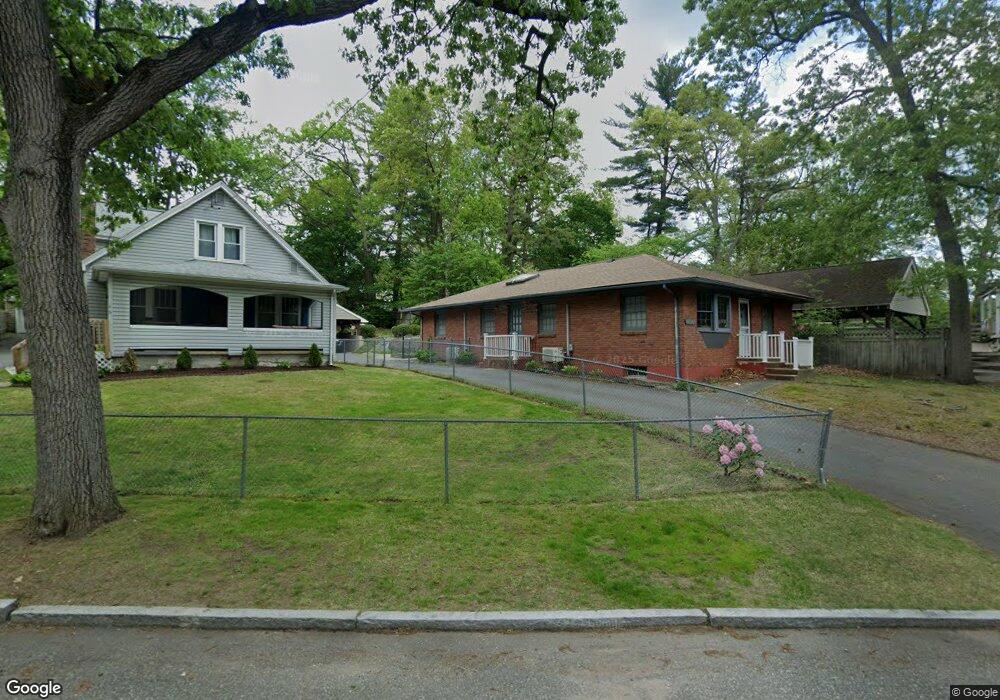
50 Bonnyview St Unit 52 Springfield, MA 01109
Upper Hill NeighborhoodEstimated Value: $312,920 - $382,000
2
Beds
3
Baths
1,544
Sq Ft
$215/Sq Ft
Est. Value
About This Home
This home is located at 50 Bonnyview St Unit 52, Springfield, MA 01109 and is currently estimated at $332,230, approximately $215 per square foot. 50 Bonnyview St Unit 52 is a home located in Hampden County with nearby schools including John J Duggan Middle, Springfield High School of Science and Technology, and Roger L. Putnam Vocational Technical Academy.
Ownership History
Date
Name
Owned For
Owner Type
Purchase Details
Closed on
Dec 21, 2018
Sold by
Slowik Matthew
Bought by
50 and Bonnyview Street T T
Current Estimated Value
Purchase Details
Closed on
Sep 25, 2008
Sold by
Harrington Eugenia and Progulske Eugenia
Bought by
Slowik Matthew J
Home Financials for this Owner
Home Financials are based on the most recent Mortgage that was taken out on this home.
Original Mortgage
$113,223
Interest Rate
6.57%
Mortgage Type
Purchase Money Mortgage
Create a Home Valuation Report for This Property
The Home Valuation Report is an in-depth analysis detailing your home's value as well as a comparison with similar homes in the area
Home Values in the Area
Average Home Value in this Area
Purchase History
| Date | Buyer | Sale Price | Title Company |
|---|---|---|---|
| 50 | -- | -- | |
| Slowik Matthew J | $115,000 | -- |
Source: Public Records
Mortgage History
| Date | Status | Borrower | Loan Amount |
|---|---|---|---|
| Previous Owner | Slowik Matthew J | $113,223 |
Source: Public Records
Tax History Compared to Growth
Tax History
| Year | Tax Paid | Tax Assessment Tax Assessment Total Assessment is a certain percentage of the fair market value that is determined by local assessors to be the total taxable value of land and additions on the property. | Land | Improvement |
|---|---|---|---|---|
| 2025 | $4,207 | $268,300 | $41,500 | $226,800 |
| 2024 | $4,004 | $249,300 | $34,500 | $214,800 |
| 2023 | $3,828 | $224,500 | $31,400 | $193,100 |
| 2022 | $3,608 | $191,700 | $29,400 | $162,300 |
| 2021 | $3,207 | $169,700 | $26,700 | $143,000 |
| 2020 | $3,152 | $161,400 | $26,700 | $134,700 |
| 2019 | $3,017 | $153,300 | $26,700 | $126,600 |
| 2018 | $3,151 | $160,100 | $26,700 | $133,400 |
| 2017 | $3,189 | $162,200 | $24,700 | $137,500 |
| 2016 | $2,967 | $150,900 | $24,700 | $126,200 |
| 2015 | $2,628 | $133,600 | $15,400 | $118,200 |
Source: Public Records
Map
Nearby Homes
- 867 Roosevelt Ave
- 75 Carnavon Cir
- 67 Carlisle St
- 111 Marlborough St
- 158 Norfolk St
- 236 Pondview Dr
- 135-137 Suffolk St
- 62-64 Bristol St
- 124-126 Westford Cir
- 0 NS (24) Alden St
- 43 Colonial Ave
- 179 Albemarle St
- 204 Arcadia Blvd
- 54 S Shore Dr
- 88 Dunmoreland St
- 63 Judith St
- 55 Monticello Ave
- 21 Westford Cir
- 74 Judith St
- 66 Walsh St
- 46 Bonnyview St
- 60 Bonnyview St
- 36 Bonnyview St
- 758 Alden St Unit 1
- 758 Alden St Unit 760
- 45 Bonnyview St
- 746-748 Alden St
- 746 Alden St Unit 748
- 37 Bonnyview St Unit 39
- 742 Alden St Unit 744
- 30 Bonnyview St Unit 32
- 30-32 Bonnyview St
- 37 Ina St
- 754 Alden St Unit 2
- 752 Alden St Unit 754
- 752-754 Alden St
- 752 Alden St Unit 1
- 43 Ina St
- 55 Bonnyview St
- 31 Bonnyview St Unit 33