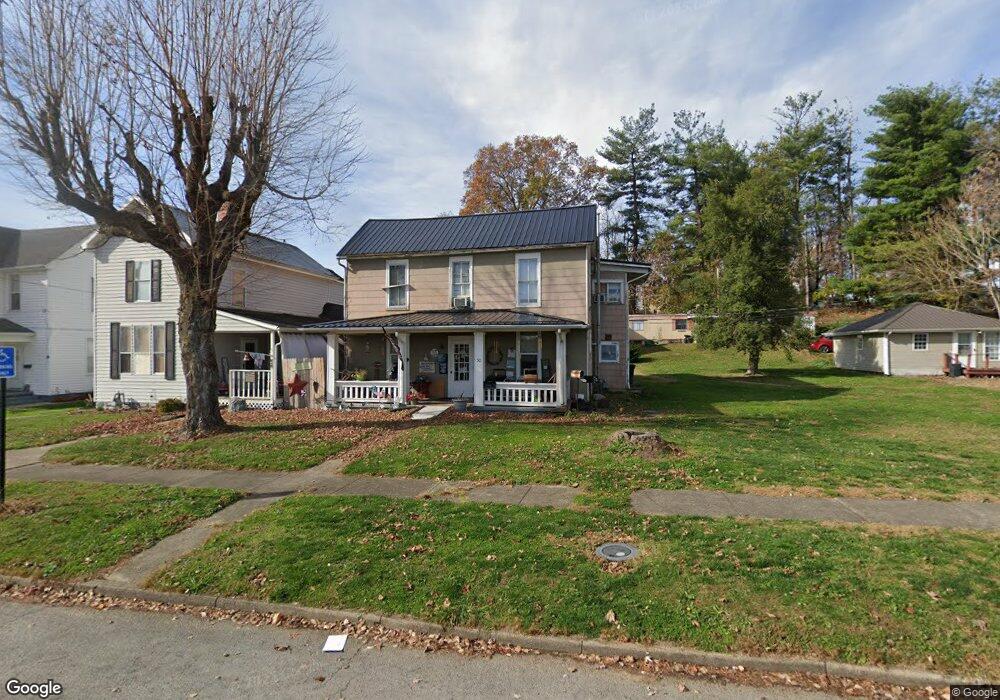
50 Center St Jackson, OH 45640
Estimated Value: $113,000 - $195,836
2
Beds
2
Baths
1,864
Sq Ft
$82/Sq Ft
Est. Value
About This Home
This home is located at 50 Center St, Jackson, OH 45640 and is currently estimated at $152,459, approximately $81 per square foot. 50 Center St is a home located in Jackson County with nearby schools including Jackson High School and Christian Life Academy.
Ownership History
Date
Name
Owned For
Owner Type
Purchase Details
Closed on
Mar 3, 2023
Sold by
Evans Joseph and Evans Patricia
Bought by
Lundy Property Management Llc
Current Estimated Value
Purchase Details
Closed on
Mar 3, 2022
Sold by
Evans Joseph D and Evans Patricia
Bought by
Lundy Property Management Llc
Home Financials for this Owner
Home Financials are based on the most recent Mortgage that was taken out on this home.
Original Mortgage
$136,000
Interest Rate
6.13%
Mortgage Type
New Conventional
Purchase Details
Closed on
Mar 20, 2002
Sold by
Evans Joseph D and Evans Patricia M
Bought by
Evans Joseph D
Purchase Details
Closed on
Jun 12, 1995
Sold by
Miller Paul Arlen
Bought by
Evans Joseph D and Evans Patricia M
Create a Home Valuation Report for This Property
The Home Valuation Report is an in-depth analysis detailing your home's value as well as a comparison with similar homes in the area
Home Values in the Area
Average Home Value in this Area
Purchase History
| Date | Buyer | Sale Price | Title Company |
|---|---|---|---|
| Lundy Property Management Llc | $160,000 | None Listed On Document | |
| Lundy Property Management Llc | $160,000 | None Listed On Document | |
| Lundy Property Management Llc | $160,000 | -- | |
| Lundy Property Management Llc | $160,000 | None Listed On Document | |
| Evans Joseph D | -- | -- | |
| Evans Joseph D | $50,000 | -- |
Source: Public Records
Mortgage History
| Date | Status | Borrower | Loan Amount |
|---|---|---|---|
| Previous Owner | Lundy Property Management Llc | $136,000 |
Source: Public Records
Tax History
| Year | Tax Paid | Tax Assessment Tax Assessment Total Assessment is a certain percentage of the fair market value that is determined by local assessors to be the total taxable value of land and additions on the property. | Land | Improvement |
|---|---|---|---|---|
| 2025 | $2,114 | $57,530 | $2,650 | $54,880 |
| 2024 | $2,134 | $57,530 | $2,650 | $54,880 |
| 2023 | $3,243 | $85,900 | $9,960 | $75,940 |
| 2022 | $3,051 | $59,830 | $4,670 | $55,160 |
| 2021 | $2,435 | $59,830 | $4,670 | $55,160 |
| 2020 | $2,414 | $59,830 | $4,670 | $55,160 |
| 2019 | $2,128 | $51,580 | $4,030 | $47,550 |
| 2018 | $2,051 | $51,580 | $4,030 | $47,550 |
| 2017 | $1,966 | $51,580 | $4,030 | $47,550 |
| 2016 | $1,742 | $45,100 | $2,980 | $42,120 |
| 2015 | $699 | $18,000 | $2,980 | $15,020 |
| 2013 | $670 | $17,280 | $2,980 | $14,300 |
| 2012 | $679 | $17,280 | $2,980 | $14,300 |
Source: Public Records
Map
Nearby Homes
Your Personal Tour Guide
Ask me questions while you tour the home.