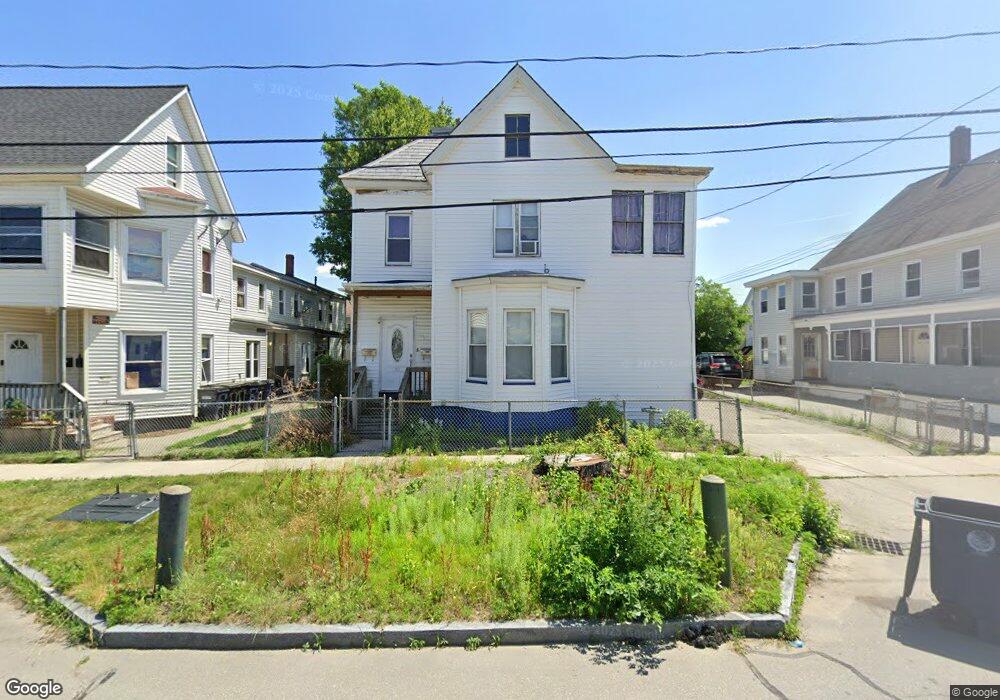
50 Chestnut St Nashua, NH 03060
Mine Falls Park NeighborhoodEstimated Value: $494,650 - $545,000
4
Beds
2
Baths
2,156
Sq Ft
$240/Sq Ft
Est. Value
About This Home
This home is located at 50 Chestnut St, Nashua, NH 03060 and is currently estimated at $517,913, approximately $240 per square foot. 50 Chestnut St is a home located in Hillsborough County with nearby schools including Amherst Street School, Pennichuck Middle School, and Nashua High School North.
Ownership History
Date
Name
Owned For
Owner Type
Purchase Details
Closed on
Apr 7, 2003
Sold by
Kurowski Sharon L
Bought by
Infante Modesta E
Current Estimated Value
Home Financials for this Owner
Home Financials are based on the most recent Mortgage that was taken out on this home.
Original Mortgage
$208,354
Outstanding Balance
$89,571
Interest Rate
5.88%
Mortgage Type
Purchase Money Mortgage
Estimated Equity
$428,342
Purchase Details
Closed on
Apr 22, 2002
Sold by
Noble Gail R
Bought by
Kurowski Sharon L
Home Financials for this Owner
Home Financials are based on the most recent Mortgage that was taken out on this home.
Original Mortgage
$127,500
Interest Rate
6.85%
Mortgage Type
Purchase Money Mortgage
Create a Home Valuation Report for This Property
The Home Valuation Report is an in-depth analysis detailing your home's value as well as a comparison with similar homes in the area
Home Values in the Area
Average Home Value in this Area
Purchase History
| Date | Buyer | Sale Price | Title Company |
|---|---|---|---|
| Infante Modesta E | $210,000 | -- | |
| Kurowski Sharon L | $170,000 | -- |
Source: Public Records
Mortgage History
| Date | Status | Borrower | Loan Amount |
|---|---|---|---|
| Open | Kurowski Sharon L | $208,354 | |
| Previous Owner | Kurowski Sharon L | $127,500 |
Source: Public Records
Tax History Compared to Growth
Tax History
| Year | Tax Paid | Tax Assessment Tax Assessment Total Assessment is a certain percentage of the fair market value that is determined by local assessors to be the total taxable value of land and additions on the property. | Land | Improvement |
|---|---|---|---|---|
| 2024 | $7,505 | $472,000 | $115,300 | $356,700 |
| 2023 | $7,033 | $385,800 | $92,300 | $293,500 |
| 2022 | $6,971 | $385,800 | $92,300 | $293,500 |
| 2021 | $5,791 | $249,400 | $58,400 | $191,000 |
| 2020 | $5,639 | $249,400 | $58,400 | $191,000 |
| 2019 | $5,640 | $259,200 | $58,400 | $200,800 |
| 2018 | $5,498 | $259,200 | $58,400 | $200,800 |
| 2017 | $4,209 | $163,200 | $53,000 | $110,200 |
| 2016 | $4,091 | $163,200 | $53,000 | $110,200 |
| 2015 | $4,003 | $163,200 | $53,000 | $110,200 |
| 2014 | $3,915 | $162,800 | $53,000 | $109,800 |
Source: Public Records
Map
Nearby Homes
- 38 Central St
- 8 Buck St Unit 10
- 5 Mulberry St
- 30 Ledge St
- 22 Wilder St
- 29 Wilder St
- 4 Badger St
- 121 Palm St
- 52 Main St Unit 402
- 24 E Otterson St
- 18 Harbor Ave Unit 208
- 32-34 Grand Ave
- 15 Lovell St Unit 20
- 15 Lovell St Unit 3
- 15 Lovell St Unit 7
- 15 Lovell St Unit 10
- 169A W Hollis St Unit 193
- 2 Lyons St
- 7 Bitirnas St Unit U7
- 13 Mulvanity St
- 52 Chestnut St Unit 54
- 48 Chestnut St
- 52-54 Chestnut St Unit 54
- 69 Walnut St
- 56 Chestnut St
- 47 1/2 Chestnut St
- 44 Chestnut St Unit 46
- 67 Walnut St Unit Z
- 67 Walnut St Unit C
- 67 Walnut St Unit B
- 67 Walnut St Unit A
- 47 Chestnut St
- 43 1/4 Chestnut St Unit ST 3/4
- 71 Walnut St
- 43 14 Chestnut
- 51 Chestnut St
- 71 1 2-73 Walnut St
- 53 Chestnut St Unit 531/2
- 49 1/2 Chestnut St
- 45 Chestnut St Unit 47