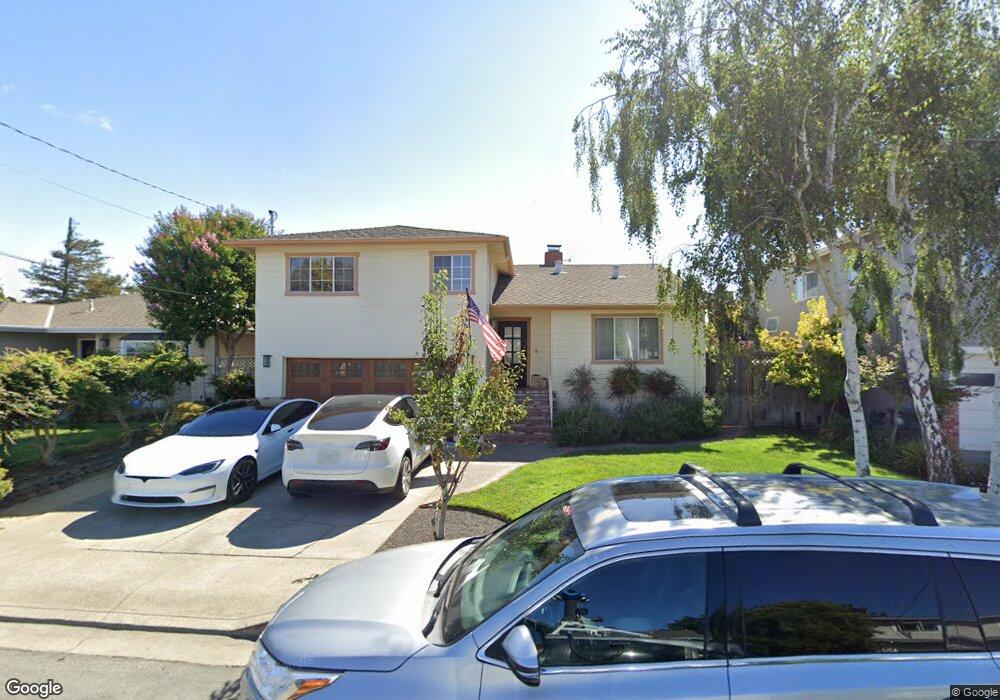
50 Chilton Ave San Carlos, CA 94070
Beverly Terrace NeighborhoodEstimated Value: $2,251,000 - $2,543,000
4
Beds
2
Baths
1,660
Sq Ft
$1,446/Sq Ft
Est. Value
About This Home
This home is located at 50 Chilton Ave, San Carlos, CA 94070 and is currently estimated at $2,399,651, approximately $1,445 per square foot. 50 Chilton Ave is a home located in San Mateo County with nearby schools including Tierra Linda Middle School, Carlmont High School, and Heather Elementary School.
Ownership History
Date
Name
Owned For
Owner Type
Purchase Details
Closed on
Sep 11, 2012
Sold by
Dugan John P
Bought by
Dugan John P and Ball Dugan Julia K
Current Estimated Value
Home Financials for this Owner
Home Financials are based on the most recent Mortgage that was taken out on this home.
Original Mortgage
$771,000
Outstanding Balance
$122,557
Interest Rate
2.82%
Mortgage Type
New Conventional
Estimated Equity
$2,277,094
Purchase Details
Closed on
Apr 19, 2004
Sold by
Ball Dugan Julia K
Bought by
Dugan John P
Home Financials for this Owner
Home Financials are based on the most recent Mortgage that was taken out on this home.
Original Mortgage
$648,750
Interest Rate
5.39%
Mortgage Type
Purchase Money Mortgage
Purchase Details
Closed on
Apr 14, 2004
Sold by
Lloyd B Dale and Lloyd Karoline
Bought by
Dugan John P
Home Financials for this Owner
Home Financials are based on the most recent Mortgage that was taken out on this home.
Original Mortgage
$648,750
Interest Rate
5.39%
Mortgage Type
Purchase Money Mortgage
Create a Home Valuation Report for This Property
The Home Valuation Report is an in-depth analysis detailing your home's value as well as a comparison with similar homes in the area
Home Values in the Area
Average Home Value in this Area
Purchase History
| Date | Buyer | Sale Price | Title Company |
|---|---|---|---|
| Dugan John P | -- | Fidelity National Title Co | |
| Dugan John P | -- | First American Title Co | |
| Dugan John P | $865,000 | First American Title Co |
Source: Public Records
Mortgage History
| Date | Status | Borrower | Loan Amount |
|---|---|---|---|
| Open | Dugan John P | $771,000 | |
| Closed | Dugan John P | $648,750 | |
| Closed | Dugan John P | $143,250 |
Source: Public Records
Tax History Compared to Growth
Tax History
| Year | Tax Paid | Tax Assessment Tax Assessment Total Assessment is a certain percentage of the fair market value that is determined by local assessors to be the total taxable value of land and additions on the property. | Land | Improvement |
|---|---|---|---|---|
| 2025 | $15,492 | $1,240,342 | $614,919 | $625,423 |
| 2023 | $15,492 | $1,192,182 | $591,042 | $601,140 |
| 2022 | $14,464 | $1,158,906 | $579,453 | $579,453 |
| 2021 | $14,261 | $1,136,184 | $568,092 | $568,092 |
| 2020 | $14,105 | $1,124,534 | $562,267 | $562,267 |
| 2019 | $13,862 | $1,102,486 | $551,243 | $551,243 |
| 2018 | $13,498 | $1,080,870 | $540,435 | $540,435 |
| 2017 | $13,324 | $1,059,678 | $529,839 | $529,839 |
| 2016 | $13,046 | $1,038,900 | $519,450 | $519,450 |
| 2015 | $13,000 | $1,023,296 | $511,648 | $511,648 |
| 2014 | $12,630 | $1,003,252 | $501,626 | $501,626 |
Source: Public Records
Map
Nearby Homes
- 28 Kirkwood Way
- 38 Sequoia Ct
- 108 Beverly Dr
- 90 Gateway Ct
- 0 Devonshire Blvd
- 000 Devonshire Blvd
- 222 Oakley Ave
- 162 Coronado Ave
- 46 Arch Ln
- 1315 Alameda de Las Pulgas
- 140 Northam Ave
- 241 Shelford Ave
- 289 Kings Ct
- 88 Madera Ave
- 1715 El Verano Way
- 65 Madera Ave
- 400 Winding Way
- 1220 Chula Vista Dr
- 21 Highland Ave
- 141 Hillcrest Rd