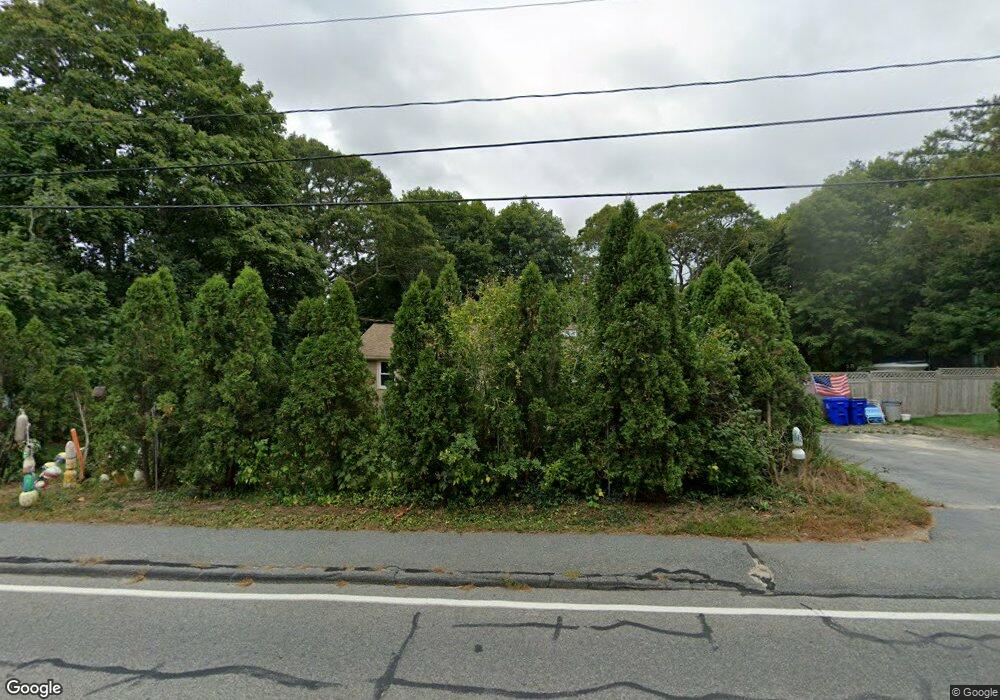
50 Clay Pond Rd Buzzards Bay, MA 02532
Monument Beach NeighborhoodEstimated Value: $454,578 - $523,000
3
Beds
1
Bath
800
Sq Ft
$617/Sq Ft
Est. Value
About This Home
This home is located at 50 Clay Pond Rd, Buzzards Bay, MA 02532 and is currently estimated at $493,645, approximately $617 per square foot. 50 Clay Pond Rd is a home located in Barnstable County with nearby schools including Bourne High School, Cadence Academy Preschool - Bourne, and St Margaret Regional School.
Ownership History
Date
Name
Owned For
Owner Type
Purchase Details
Closed on
Apr 30, 1998
Sold by
Macleod Joan Est
Bought by
Stanley George A and Stanley Theresa C
Current Estimated Value
Home Financials for this Owner
Home Financials are based on the most recent Mortgage that was taken out on this home.
Original Mortgage
$97,900
Interest Rate
7.04%
Mortgage Type
Purchase Money Mortgage
Create a Home Valuation Report for This Property
The Home Valuation Report is an in-depth analysis detailing your home's value as well as a comparison with similar homes in the area
Home Values in the Area
Average Home Value in this Area
Purchase History
| Date | Buyer | Sale Price | Title Company |
|---|---|---|---|
| Stanley George A | $96,000 | -- | |
| Stanley George A | $96,000 | -- |
Source: Public Records
Mortgage History
| Date | Status | Borrower | Loan Amount |
|---|---|---|---|
| Open | Stanley George A | $95,000 | |
| Closed | Stanley George A | $20,000 | |
| Closed | Stanley George A | $97,900 |
Source: Public Records
Tax History Compared to Growth
Tax History
| Year | Tax Paid | Tax Assessment Tax Assessment Total Assessment is a certain percentage of the fair market value that is determined by local assessors to be the total taxable value of land and additions on the property. | Land | Improvement |
|---|---|---|---|---|
| 2025 | $2,956 | $378,500 | $180,100 | $198,400 |
| 2024 | $2,890 | $360,400 | $171,500 | $188,900 |
| 2023 | $2,810 | $319,000 | $151,800 | $167,200 |
| 2022 | $2,695 | $267,100 | $134,400 | $132,700 |
| 2021 | $2,618 | $243,100 | $122,300 | $120,800 |
| 2020 | $2,529 | $235,500 | $121,100 | $114,400 |
| 2019 | $2,408 | $229,100 | $121,100 | $108,000 |
| 2018 | $2,245 | $213,000 | $115,400 | $97,600 |
| 2017 | $2,062 | $200,200 | $108,600 | $91,600 |
| 2016 | $1,866 | $183,700 | $108,600 | $75,100 |
| 2015 | $1,734 | $172,200 | $97,100 | $75,100 |
Source: Public Records
Map
Nearby Homes